GA4 Alternatives Compared: Which Tools Actually Fix Reporting, Retention, and Tracking Problems?
Data retention, sampling, event modelling and the reporting UI. Four criteria that decide whether a migration is worth it.

Google Analytics 4 (GA4) is powerful. That doesn’t mean everyone enjoys using it.
Ask a marketing manager why they’re looking for a GA4 alternative, and the answer usually isn’t that they need another analytics feature. It’s that a report takes too long to build, traffic numbers don’t match expectations, or a straightforward business question requires navigating several menus.
For an analyst, the frustration might be different. Event-level retention limits complicate historical investigations. Sampling can affect large exploratory queries, while consent-based behavioral modeling introduces another layer of interpretation.
And for small business owners? Sometimes they just want to know where visitors came from, which pages performed well, and whether people submitted an inquiry.
These aren’t necessarily problems with GA4’s underlying capabilities. They’re problems with how those capabilities fit different teams.
The best GA4 alternative isn’t automatically the one with the most features. It’s the one that answers your recurring questions reliably, without introducing more complexity than it removes.
This guide compares eight alternatives: Matomo, Plausible Analytics, Fathom Analytics, Umami, Simple Analytics, Piwik PRO, PostHog, and Mixpanel.
We’ll examine what each product actually changes, where it falls short, and when keeping GA4 might be the better decision.
We’ll also look at how Digimetrics.ai can complement GA4 through connected marketing reporting and SEO diagnostics.
Why Teams Look for GA4 Alternatives
Before comparing software, it’s worth identifying what actually needs fixing.
If complicated reporting is your biggest frustration, switching your analytics platform isn’t necessarily the first step. Our comparison of the best marketing dashboards in 2026 examines how different reporting tools turn the same marketing data into actionable decisions.
Switching analytics platforms because the interface feels frustrating is understandable. But replacing GA4 won’t automatically solve unreliable event tracking, inconsistent campaign tagging, or poorly defined conversions.
Four complaints deserve closer examination.
1. Historical Data Isn’t Always Available for the Analysis You Need
GA4’s standard properties offer event-level and user-level data retention settings of two or 14 months, with two months as the default.
This restriction primarily affects explorations and certain detailed analyses. It doesn’t mean your standard aggregated historical reports disappear after 14 months.
That’s an important distinction.
A marketer might still examine historical acquisition trends in standard reports but find that the underlying event-level detail needed for a particular exploration is no longer available.
Google Analytics 360 offers longer event-retention options, while BigQuery exports provide another route for retaining raw event data independently of the GA4 interface.
However, the BigQuery approach introduces additional technical work and potentially storage and processing costs.
For a team without data engineering resources, retaining more history is only useful if someone can actually query it.
Source: Google Analytics data retention documentation.
2. Sampling, Thresholding, and Estimates Can Complicate Reporting
GA4 doesn’t sample every report.
Its reporting architecture includes aggregated tables designed to answer common requests without sampling. More complex explorations may use sampled data when queries exceed applicable limits.
For standard properties, the exploration sampling threshold is generally 10 million events per query.
Other mechanisms can also affect results. Privacy thresholds may suppress certain data, high-cardinality dimensions can produce an “(other)” row, and some unique-user metrics rely on estimation techniques.
These issues shouldn’t be treated as interchangeable.
A report that’s sampled isn’t experiencing the same problem as a report affected by privacy thresholds or incomplete tracking.
If you’re reviewing a small site’s monthly traffic, you might never encounter a meaningful sampling problem. If you’re investigating large datasets with complicated segments, it may matter much more.
Source: Google Analytics sampling documentation.
3. Event Tracking Requires More Planning Than Many Teams Expect
GA4 uses an event-based measurement model.
That’s useful for tracking interactions across websites and applications, but it also requires teams to make decisions about event names, parameters, key events, and reporting definitions.
For example, a company might track:
generate_leadwhen someone submits an inquiry.sign_upwhen someone creates an account.purchasewhen an ecommerce transaction completes.
Those events are valuable only if they’re implemented consistently.
If a form submission fires twice, changing analytics platforms won’t fix the underlying measurement problem.
Some GA4 alternatives simplify event tracking by focusing on pageviews, predefined goals, and common website interactions. Others offer even more detailed behavioral analytics and therefore require comparable or greater implementation work.
The right model depends on the questions your team needs to answer.
4. The Reporting Interface Creates Unnecessary Work
This is where simpler analytics products have a convincing argument.
A business owner shouldn’t need to become an analytics specialist to answer basic questions about website traffic.
Similarly, an SEO editor shouldn’t have to create a custom exploration every time they want to investigate which articles generate leads.
GA4 provides considerable reporting flexibility, but flexibility and accessibility aren’t the same thing.
For teams with simple reporting requirements, a smaller tool can be more effective precisely because it offers fewer decisions to make.
For SEO teams, the bigger challenge is often connecting organic traffic to commercial outcomes. Our guide to SEO reporting dashboard tools explains how to combine GA4, Google Search Console, and business performance data without relying on traffic numbers alone.
GA4 Alternatives Compared: Quick Overview
The following table compares each platform’s primary use case rather than treating every product as an identical replacement.
| Tool | Best For | Data Retention | Pricing Starting Point |
|---|---|---|---|
| Matomo | Data ownership and comprehensive web analytics | Cloud: 24 months raw data; aggregated reports retained indefinitely. Self-hosted: configurable | Free self-hosted software; paid cloud |
| Plausible Analytics | Simple, privacy-focused website reporting | No standard retention limit on hosted plans | From $9/month |
| Fathom Analytics | Publishers, agencies, and straightforward reporting | Full analytics history while subscribed | From $15/month |
| Umami | Lightweight analytics and self-hosting | Cloud: 6 months to 5 years depending on plan | Free; Pro from $20/month |
| Simple Analytics | Cookieless traffic measurement | Plan-dependent; free plan retains 30 days | Free plan; paid plans available |
| Piwik PRO | Enterprise analytics and regulated environments | Generally 25 months; custom enterprise options | Enterprise from $25,000/year |
| PostHog | Product analytics and behavioral investigation | Free: 1 year; paid: 7 years | Free up to 1 million analytics events/month |
| Mixpanel | Conversion funnels, cohorts, and retention analysis | Default 2 years for new projects | Free up to 1 million events/month |
Pricing and retention reflect publicly documented information reviewed in October 2026. Plans, billing intervals, usage allowances, and contract terms can change. Self-hosted retention also depends on configuration and storage policies.
There’s no single winner because these tools aren’t solving exactly the same problem.
Plausible and Fathom concentrate on making website analytics easier to understand. Matomo and Piwik PRO offer broader measurement capabilities. PostHog and Mixpanel lean toward understanding how people use products, rather than simply reporting website traffic.
That’s why the comparison needs to go beyond feature checklists.
1. Matomo: Best for Teams That Want More Control Over Analytics Data
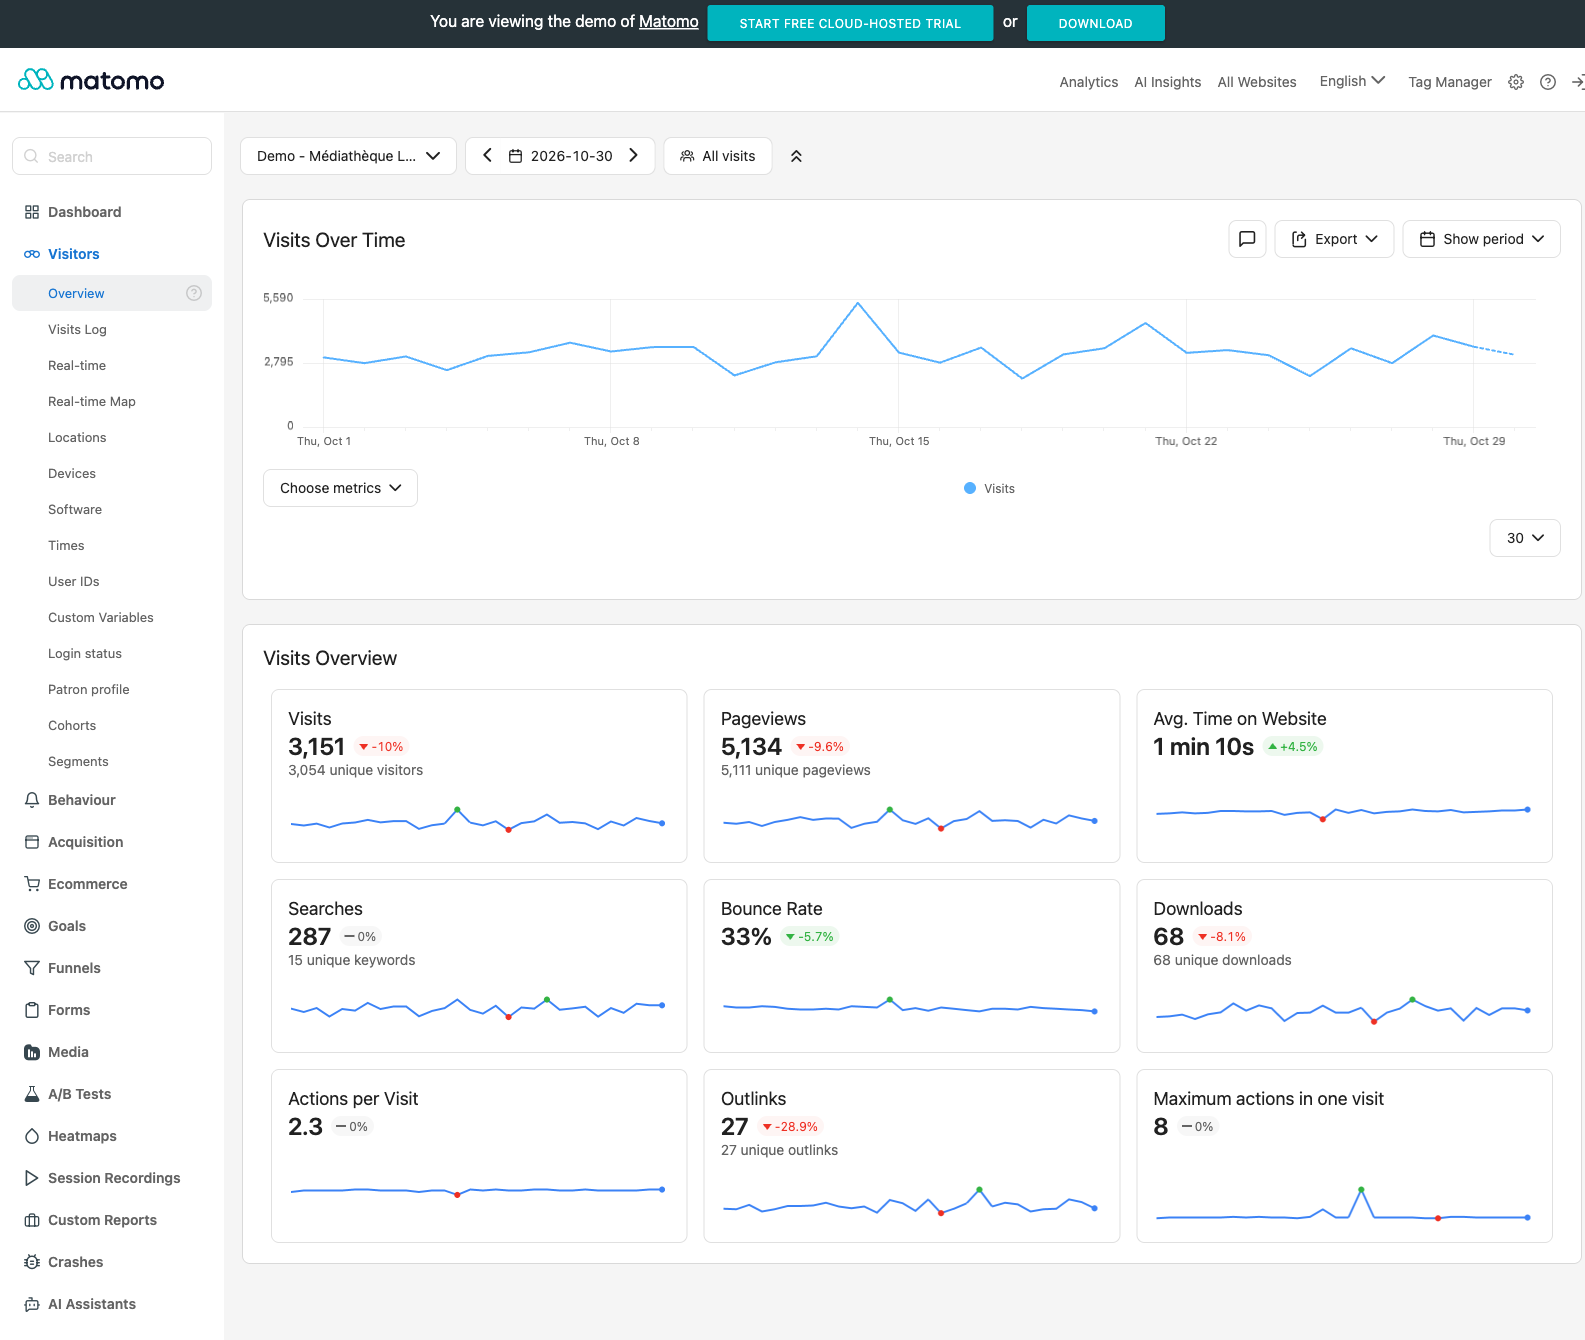
Best suited for: Organizations that need detailed website analytics, stronger control over data storage, or a self-hosted deployment option.
Matomo is one of the more comprehensive GA4 alternatives.
It supports website traffic reporting, campaign tracking, events, ecommerce measurement, goals, and visitor-level analysis. Its reporting approach will feel more familiar to teams that previously worked with traditional web analytics platforms.
The major difference is deployment flexibility.
Organizations can use Matomo Cloud or host the software on their own infrastructure.
Data Retention and Sampling
Matomo Cloud’s published Business plan retains raw data for 24 months and aggregated report data indefinitely.
Self-hosted installations offer configurable retention, with practical limits determined by storage, infrastructure capacity, and applicable privacy requirements.
Matomo also states that its reporting does not rely on data sampling. However, that shouldn’t be confused with unlimited report dimensions or unrestricted performance.
Its documentation notes that some tables are truncated by default for performance reasons, with configuration options available in self-hosted installations.
That distinction matters when teams require detailed reporting across large datasets.
Event Tracking and Reporting
Matomo supports event tracking, goals, ecommerce reporting, and customizable dashboards.
Its main attraction is the breadth of analysis available without requiring teams to use GA4’s exact event and reporting model.
However, self-hosting introduces operational responsibilities. Someone must manage the application, database, backups, performance, and security updates.
The software may be free to install, but the total cost of ownership isn’t necessarily zero.
Where Matomo Makes Sense
Consider an organization that wants several years of detailed website measurement while maintaining direct control over where its data is stored.
Matomo provides a credible route toward that goal, especially if the organization already has the infrastructure and technical resources needed.
Our assessment: Matomo is a strong candidate for teams seeking a broad GA4 replacement with more deployment and data-control options. It’s less compelling when the only complaint is that GA4’s dashboard feels too complicated.
2. Plausible Analytics: Best for Teams That Want Answers Without Complex Reports
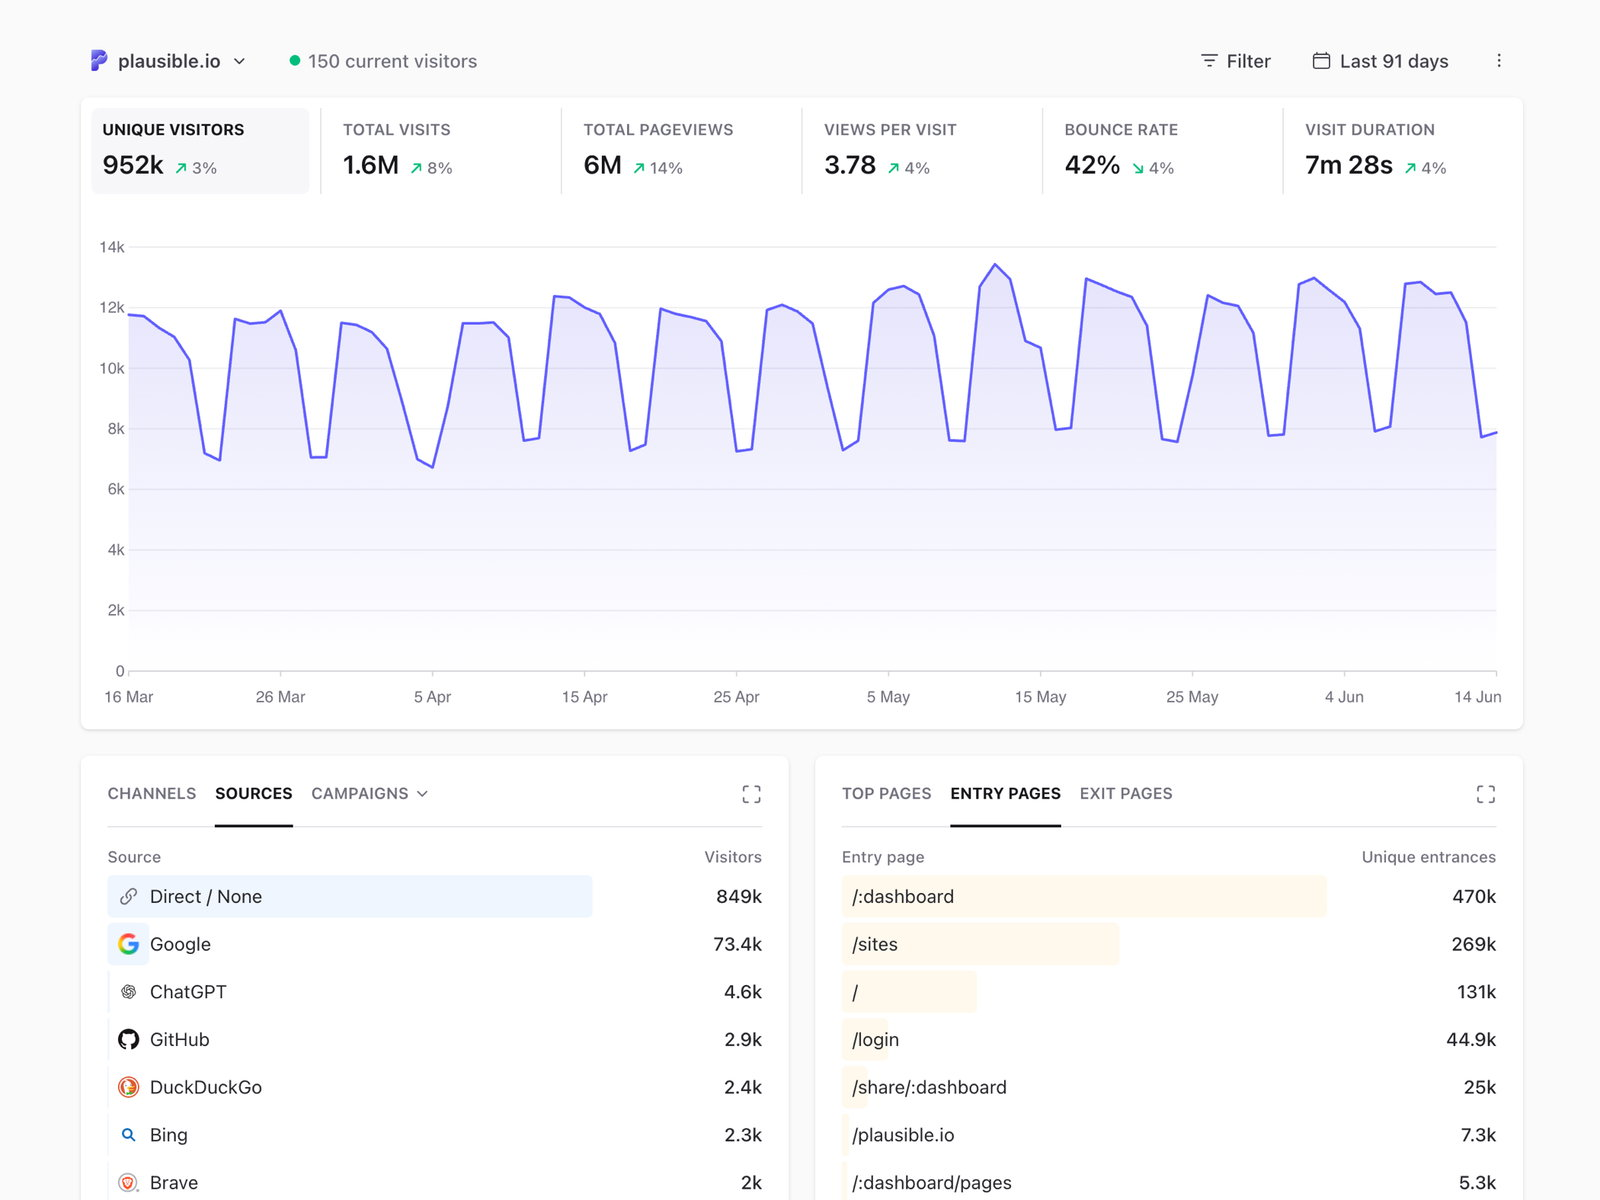
Best suited for: Small businesses, publishers, content teams, and agencies focused on straightforward website performance.
Plausible Analytics takes a different approach from GA4.
Instead of reproducing every reporting feature, it concentrates on presenting useful website information in a simpler dashboard.
Visitors, traffic sources, landing pages, campaigns, events, and conversions are designed to be understandable without building a collection of custom reports.
Data Retention and Sampling
Plausible advertises no standard retention limit on its hosted plans.
Its documentation also states that data isn’t sampled by default. However, limited sampling can apply to certain large dashboard views, including situations involving more than 10 million pageviews.
That’s a more precise claim than saying the platform never samples data.
For most small websites, this is unlikely to be a daily concern. Large publishers should verify the behavior of their most important reports.
Event Tracking and Reporting
Plausible supports goals, custom events, automatic tracking of selected interactions, funnels, and user journeys.
It also provides campaign analysis and Google Search Console integration.
A practical advantage is how quickly someone can understand the dashboard.
For example, a content manager can investigate which pages receive search traffic and which pages generate conversions without constructing an advanced exploration.
The limitation is intentional: Plausible isn’t designed around identifying individual users or reconstructing their complete behavior across multiple sessions.
If you need account-level retention, detailed user histories, or advertising audience activation, it isn’t a direct substitute.
Pricing
Plausible’s entry-level Starter plan is advertised from $9 per month, with pricing influenced by pageview volume and selected features.
Its hosted service includes a free trial, while self-hosting is available through its Community Edition.
Our assessment: Plausible is one of the clearest options for teams that primarily want understandable website and conversion reports. Its simplicity becomes a limitation when the business needs individual user journeys or sophisticated product analysis.
3. Fathom Analytics: Best for Agencies and Publishers That Prefer Simple Reporting
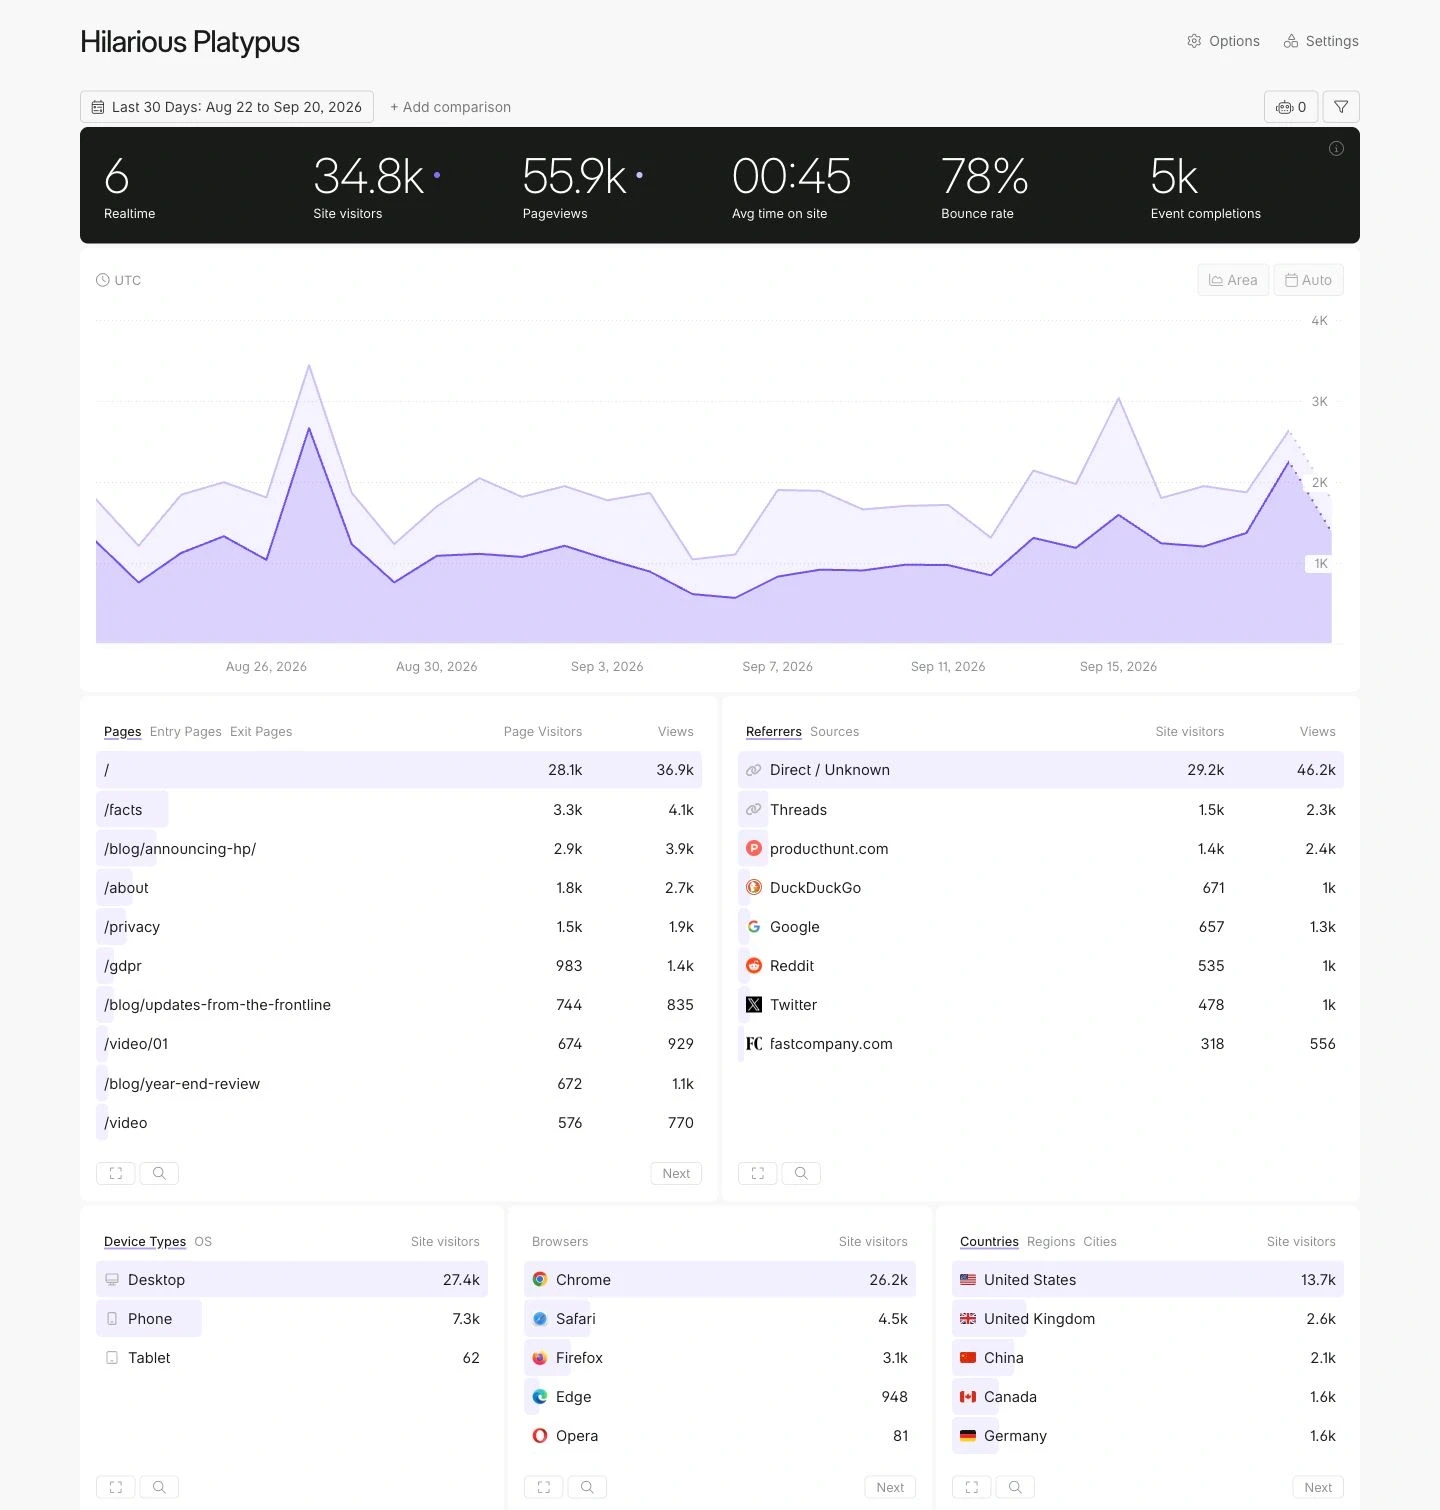
Best suited for: Content publishers, business websites, and agencies managing multiple properties.
Fathom Analytics focuses on making essential website reporting accessible.
Its dashboard emphasizes traffic, referrers, campaigns, events, and conversions, rather than extensive configuration.
For teams that mainly use analytics to produce monthly performance updates, this narrower scope can be attractive.
Data Retention and Reporting
Fathom advertises full analytics history while a subscription remains active.
Its reporting includes traffic sources, UTM campaigns, event tracking, and revenue tracking.
Saved views and shared dashboards can also make recurring client reporting more convenient.
The main difference from GA4 is the amount of setup and interpretation expected from the user.
A small agency may find it easier to show a client website traffic and conversion trends without explaining a more complex reporting environment.
However, simple presentation doesn’t automatically mean better measurement accuracy.
Teams should still verify the treatment of bots, campaign attribution, custom events, and conversion definitions.
Pricing
Fathom advertises plans beginning at $15 per month for up to 100,000 monthly pageviews.
Its pricing documentation notes that pageviews and custom events share the plan allowance.
That matters if a website generates many interactions per visit.
A site with modest traffic but extensive custom-event tracking may consume its allowance differently from a site that only tracks pageviews.
Our assessment: Fathom is appealing when agencies and publishers want predictable, readable reporting without creating complex dashboards. It isn’t intended to reproduce the full analytical depth of GA4.
4. Umami: Best for Lightweight Analytics and Flexible Self-Hosting
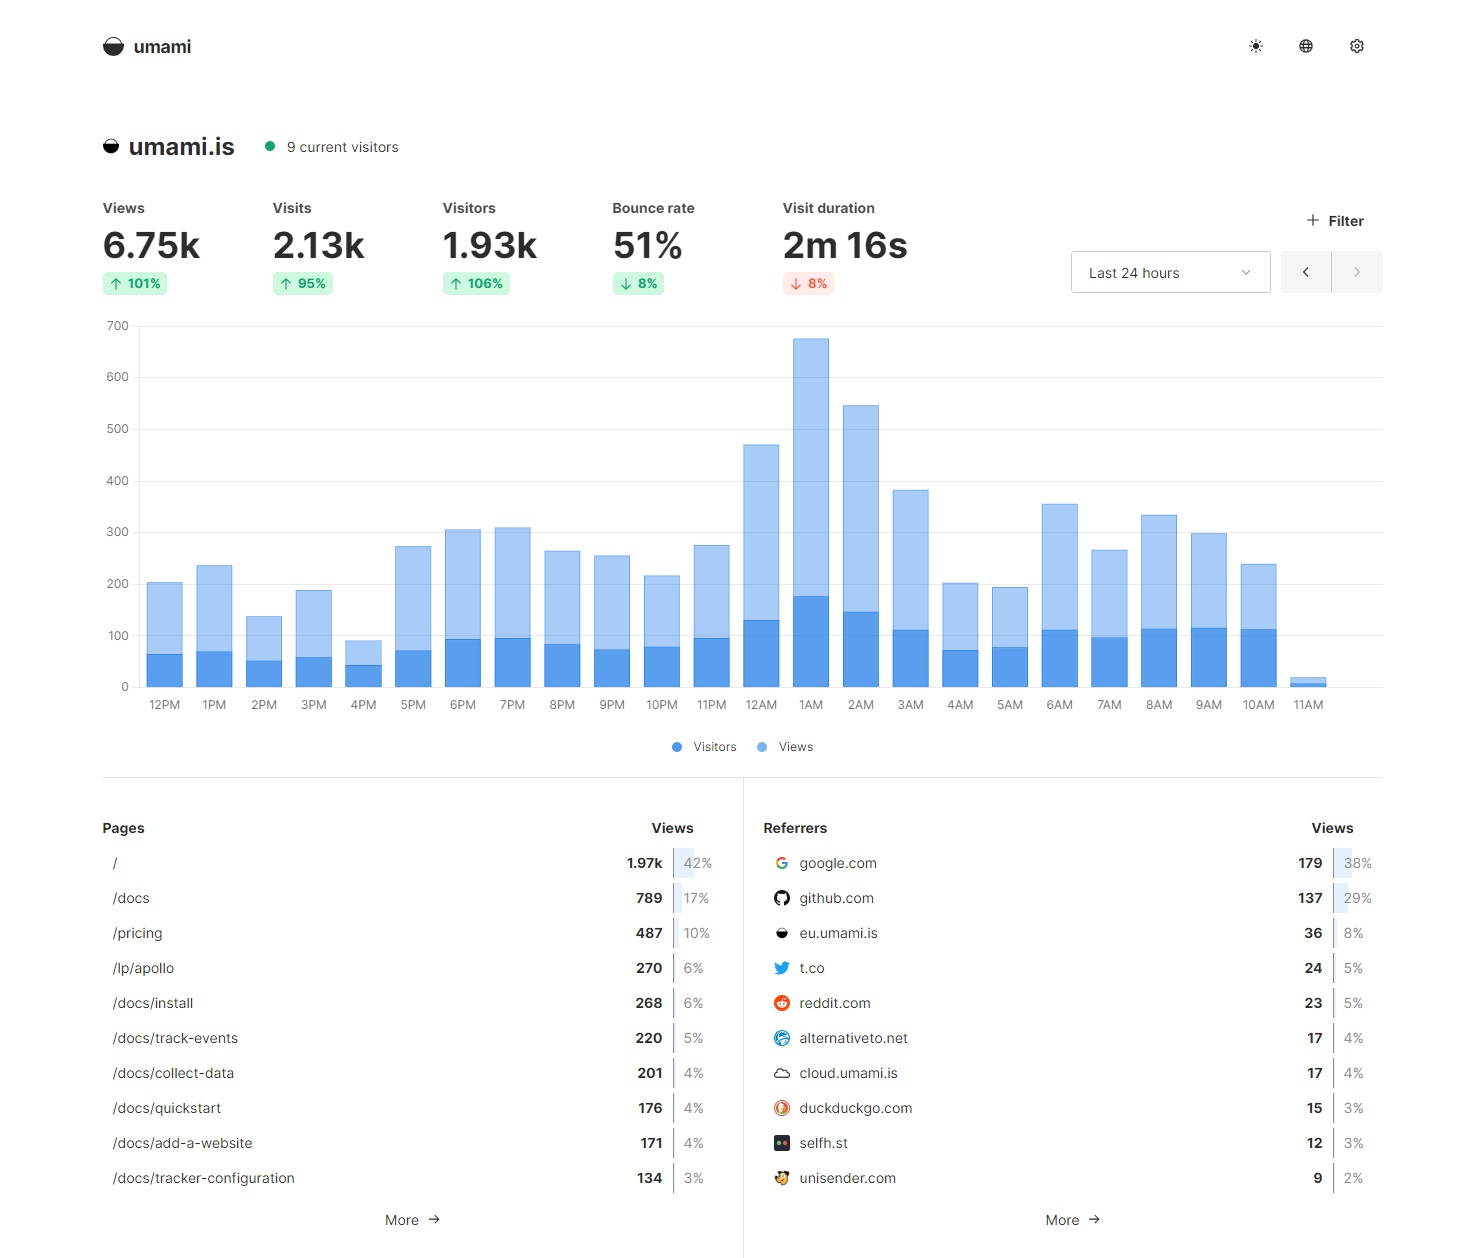
Best suited for: Developers, small websites, and organizations that want straightforward analytics with an open-source option.
Umami combines a relatively simple analytics interface with deployment flexibility.
It supports website traffic reporting, custom events, funnels, and other behavioral analytics capabilities.
Its appeal is especially clear for teams comfortable managing their own infrastructure.
Data Retention
Umami Cloud’s documented retention periods vary significantly by plan:
| Plan | Analytics Retention |
|---|---|
| Hobby | 6 months |
| Pro | 2 years |
| Business | 5 years |
| Enterprise | Custom |
Self-hosted installations retain data indefinitely unless administrators configure or perform deletion.
This makes the hosting choice particularly important.
Someone choosing the free hosted plan specifically to escape GA4 retention restrictions may discover that Umami’s six-month allowance is actually shorter than GA4’s configurable 14-month event-retention option.
Event Tracking and Reporting
Umami supports custom events and common website analytics workflows.
Its product analytics capabilities also extend to funnels, retention, and cohorts, although teams should compare the exact depth of those reports with their requirements.
For websites that don’t need extensive marketing attribution or complicated advertising integrations, the narrower approach may be sufficient.
Pricing
Umami Cloud advertises a free Hobby plan with up to 100,000 events monthly.
Pro starts at $20 per month with 1 million included events, while Business starts at $200 per month with a higher event allowance and additional features.
Self-hosting removes the cloud subscription but introduces infrastructure and maintenance expenses.
Our assessment: Umami is worth considering when teams value lightweight analytics, straightforward events, and control over hosting. Check retention and event allowances carefully before choosing a cloud plan.
5. Simple Analytics: Best for Understanding Traffic Without Visitor-Level Tracking
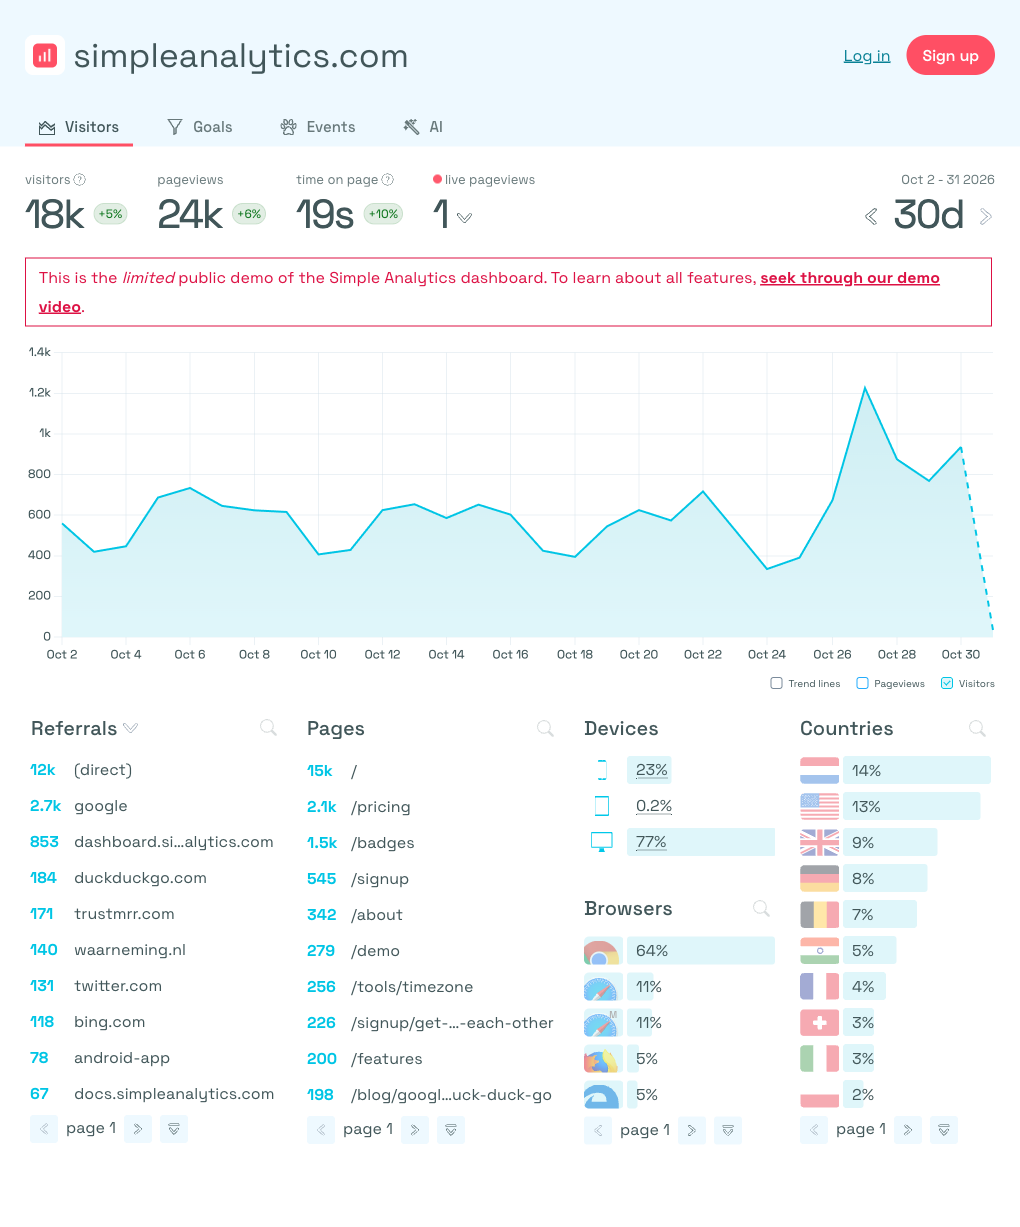
Best suited for: Privacy-conscious websites and teams that want an independently collected, cookieless traffic dataset.
Simple Analytics emphasizes measuring website activity without collecting personal identifiers.
Its current positioning is particularly interesting because it doesn’t insist that every company abandon GA4.
Instead, it proposes running alongside GA4 to provide an additional measurement baseline.
Why That Matters
Imagine a website where many visitors decline analytics cookies.
Depending on the GA4 consent implementation, some activity may not appear as directly observed user or session data. Eligible GA4 properties can use behavioral modeling in supported reports, but modeled data and directly observed data aren’t identical concepts.
Simple Analytics provides a separate view of pageviews, events, referrers, and campaigns without relying on visitor identifiers.
That can be useful when investigating whether consent-related measurement gaps affect traffic reporting.
However, the two systems use different measurement methods and session definitions.
Their totals shouldn’t be expected to match.
Data Retention and Reporting
Simple Analytics’ free plan displays the most recent 30 days of data, with older data deleted under its published retention policy.
Paid-plan retention depends on the subscription.
Its focus remains on aggregate website activity rather than individual user histories or cross-device behavioral tracking.
This makes the product attractive for particular privacy and reporting requirements, but less suitable for detailed user-level attribution.
What We’d Test
I’d run Simple Analytics alongside GA4 for at least two weeks and examine whether changes in traffic direction, source mix, and campaign performance remain consistent.
Rather than declaring whichever tool reports more visitors to be more accurate, I’d document differences in session definitions, consent behavior, and bot filtering.
Our assessment: Simple Analytics provides an interesting approach for organizations that want a cookieless measurement layer or a simpler website analytics experience. It shouldn’t be evaluated as a full replacement for GA4’s user-level advertising and behavioral analytics.
6. Piwik PRO: Best for Enterprise Teams With Detailed Governance Requirements
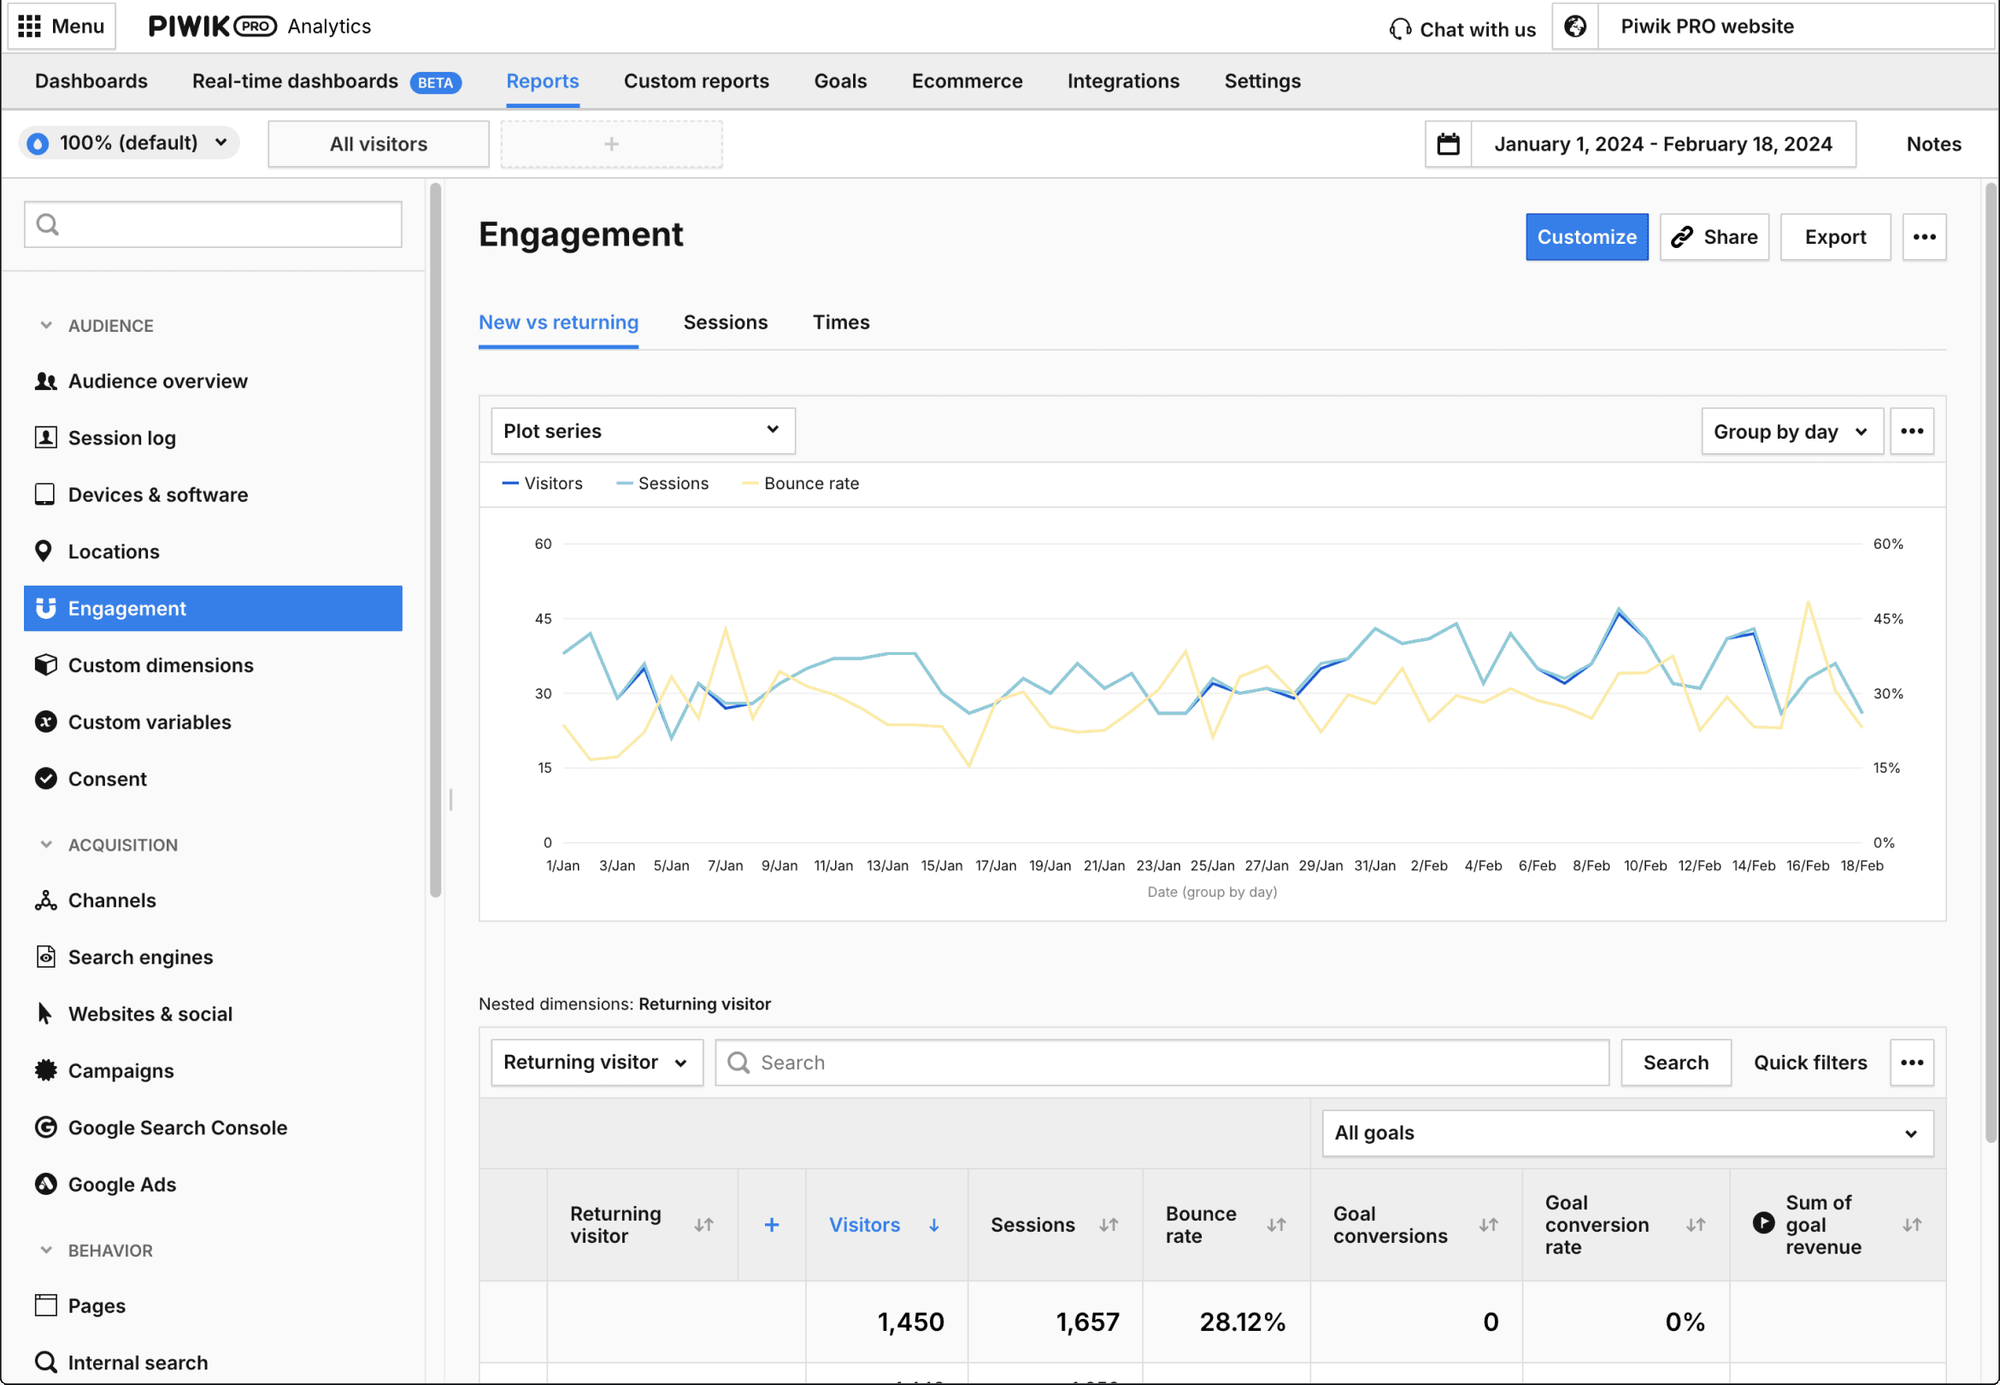
Best suited for: Larger organizations, regulated industries, and teams requiring formal data governance and enterprise support.
Piwik PRO combines analytics with broader data-management and governance capabilities.
Its positioning is different from lightweight analytics products such as Plausible or Fathom.
Organizations evaluating Piwik PRO are often concerned with issues such as data residency, permissions, implementation requirements, compliance, and integration with existing systems.
Data Retention and Sampling
Piwik PRO’s published retention documentation lists 25 months of visitor data for its Business plan, with custom options for Enterprise.
Its enterprise on-premises deployment supports different retention arrangements.
Piwik PRO uses full collected datasets by default in reporting, but also offers optional sampling controls to improve report performance when needed.
This is an important distinction: optional sampling isn’t necessarily a defect if users can understand and control when it’s applied.
Event Tracking and Reporting
Piwik PRO supports events, goals, customer journeys, campaign analysis, and more advanced reporting.
It also provides raw-data export options for teams that need deeper analysis outside the standard interface.
However, those capabilities introduce implementation and procurement considerations.
A company replacing GA4 because its marketing team dislikes complicated dashboards may not benefit from another enterprise-grade analytics system.
Pricing
Piwik PRO’s current public pricing lists Enterprise starting from $25,000 annually, with final costs depending on organizational requirements.
Healthcare-oriented enterprise options are priced separately.
Our assessment: Piwik PRO is a serious contender when analytics governance, enterprise deployment, and longer-term measurement requirements justify the investment. It is unlikely to be the most economical choice for small sites seeking only a simpler dashboard.
7. PostHog: Best for Teams Investigating Product Behavior
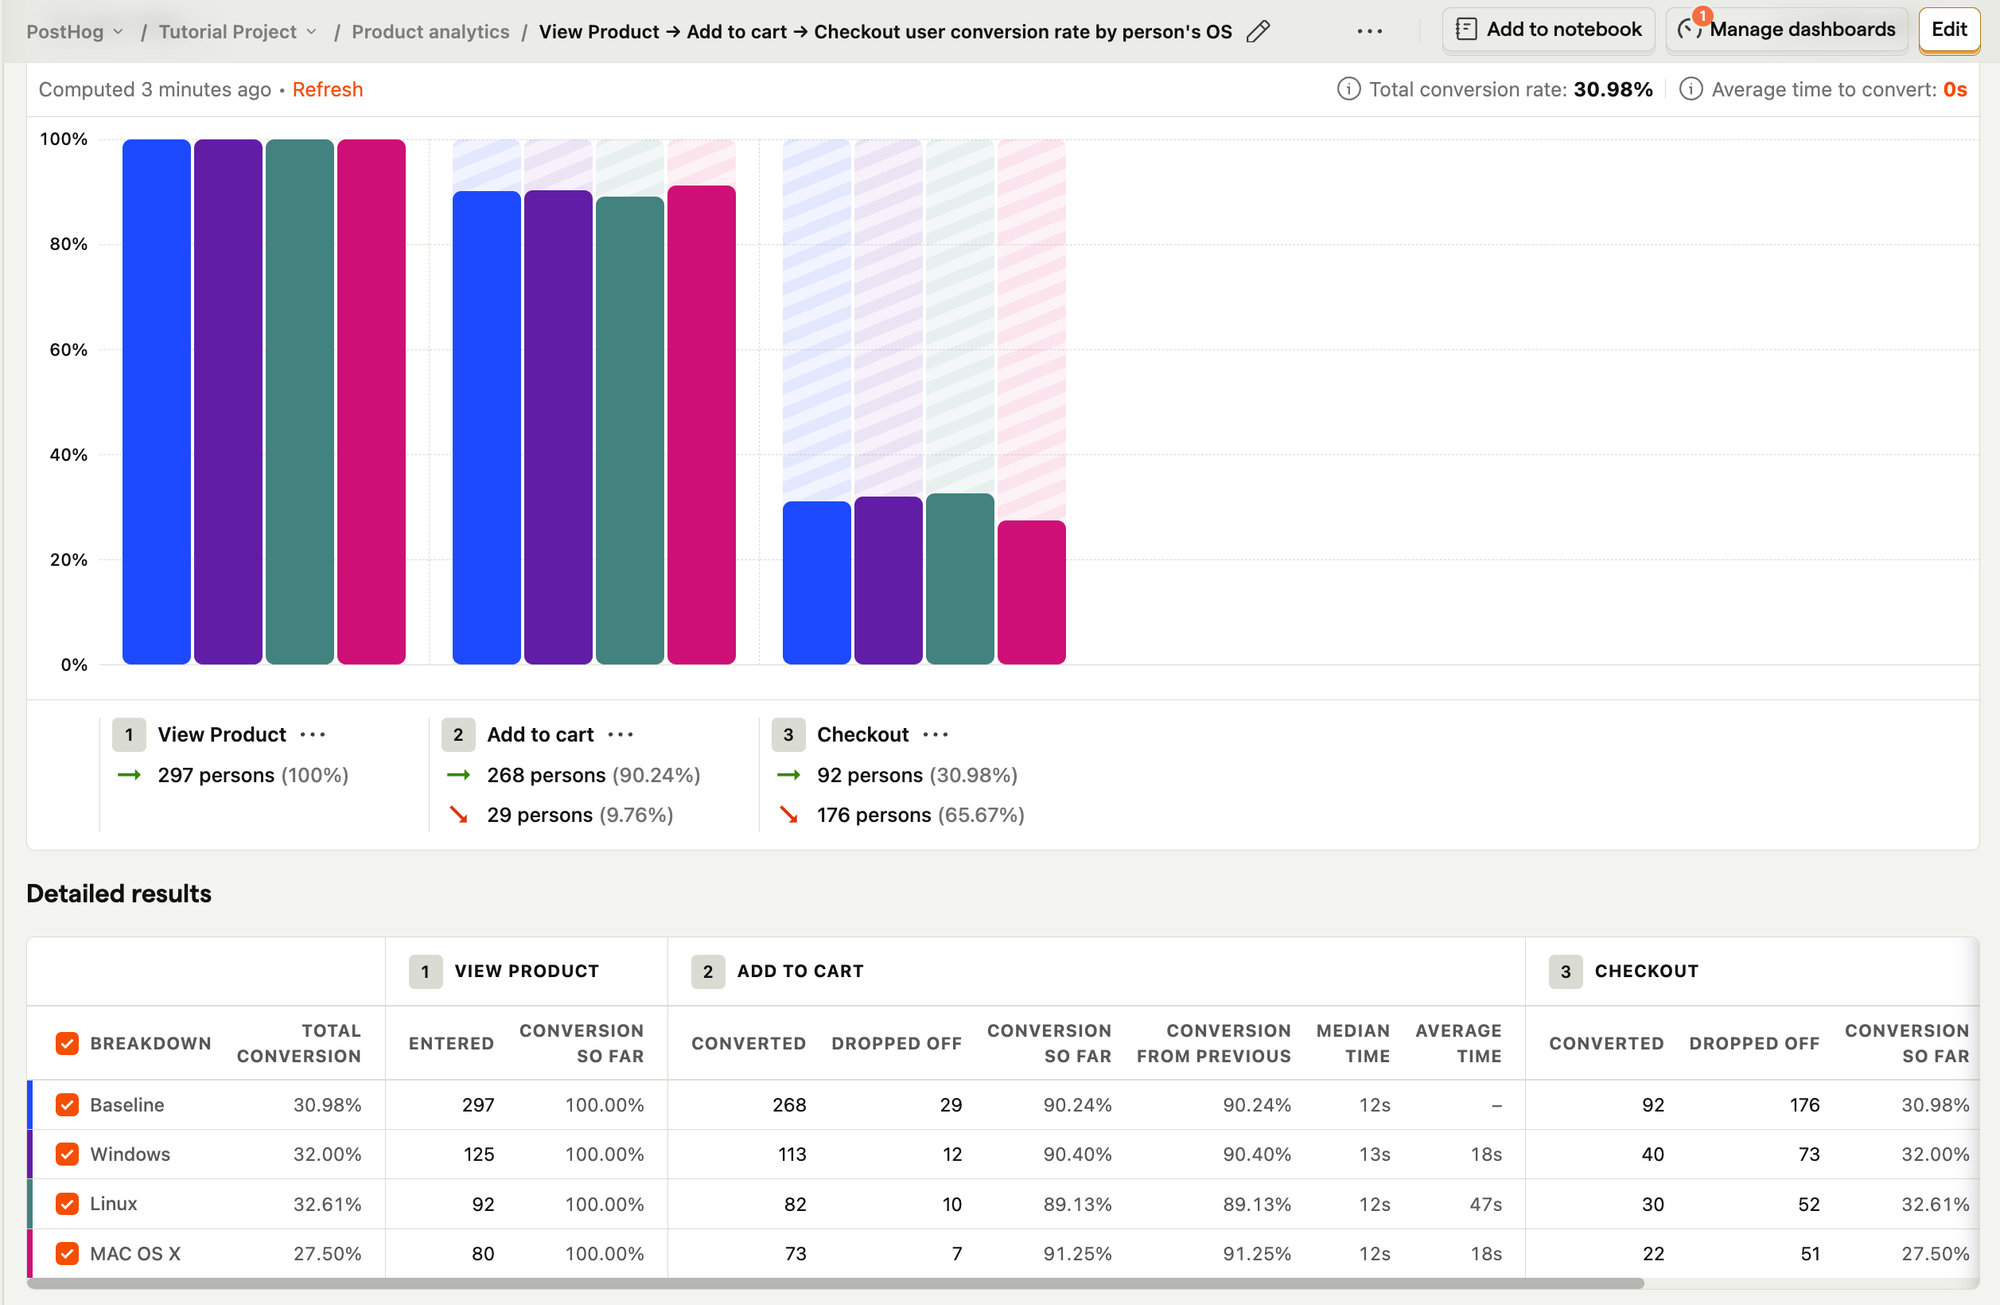
Best suited for: SaaS companies, product managers, developers, and teams investigating conversion and onboarding problems.
PostHog isn’t simply a website traffic dashboard.
It combines web and product analytics with capabilities such as session replay, feature flags, experimentation, and other product-development tools.
That changes the kind of questions it can help answer.
GA4 can show that users arrived at a signup page and triggered an event. A product analytics platform can help investigate what happened during the broader product experience, provided the necessary events were implemented.
Data Retention
PostHog’s current published terms guarantee one year of event data retention on its free plan and seven years on paid plans.
Session recordings have separate retention periods and should not be confused with analytics event history.
This is a useful example of why buyers must examine retention by data type rather than treating it as one number.
Event Tracking and Reporting
PostHog supports funnels, retention analysis, event-based reporting, and product-focused investigation.
For example, a SaaS team could examine the percentage of new accounts that complete onboarding, where users abandon a setup process, and how behavior changes after a product update.
That may be more useful than a traditional acquisition dashboard when product activation is the business’s main concern.
The tradeoff is implementation complexity.
Product analytics requires a meaningful event taxonomy, reliable instrumentation, and agreement on how metrics such as activation or retention are defined.
Pricing
PostHog advertises a free monthly allowance of 1 million analytics events, with usage-based pricing beyond included limits.
It also provides billing controls for managing expenses.
Our assessment: PostHog is particularly attractive when the frustration with GA4 involves understanding product behavior rather than website traffic alone. It’s less appropriate if the organization only wants a monthly traffic report.
8. Mixpanel: Best for Conversion Funnels, Cohorts, and Retention Analysis
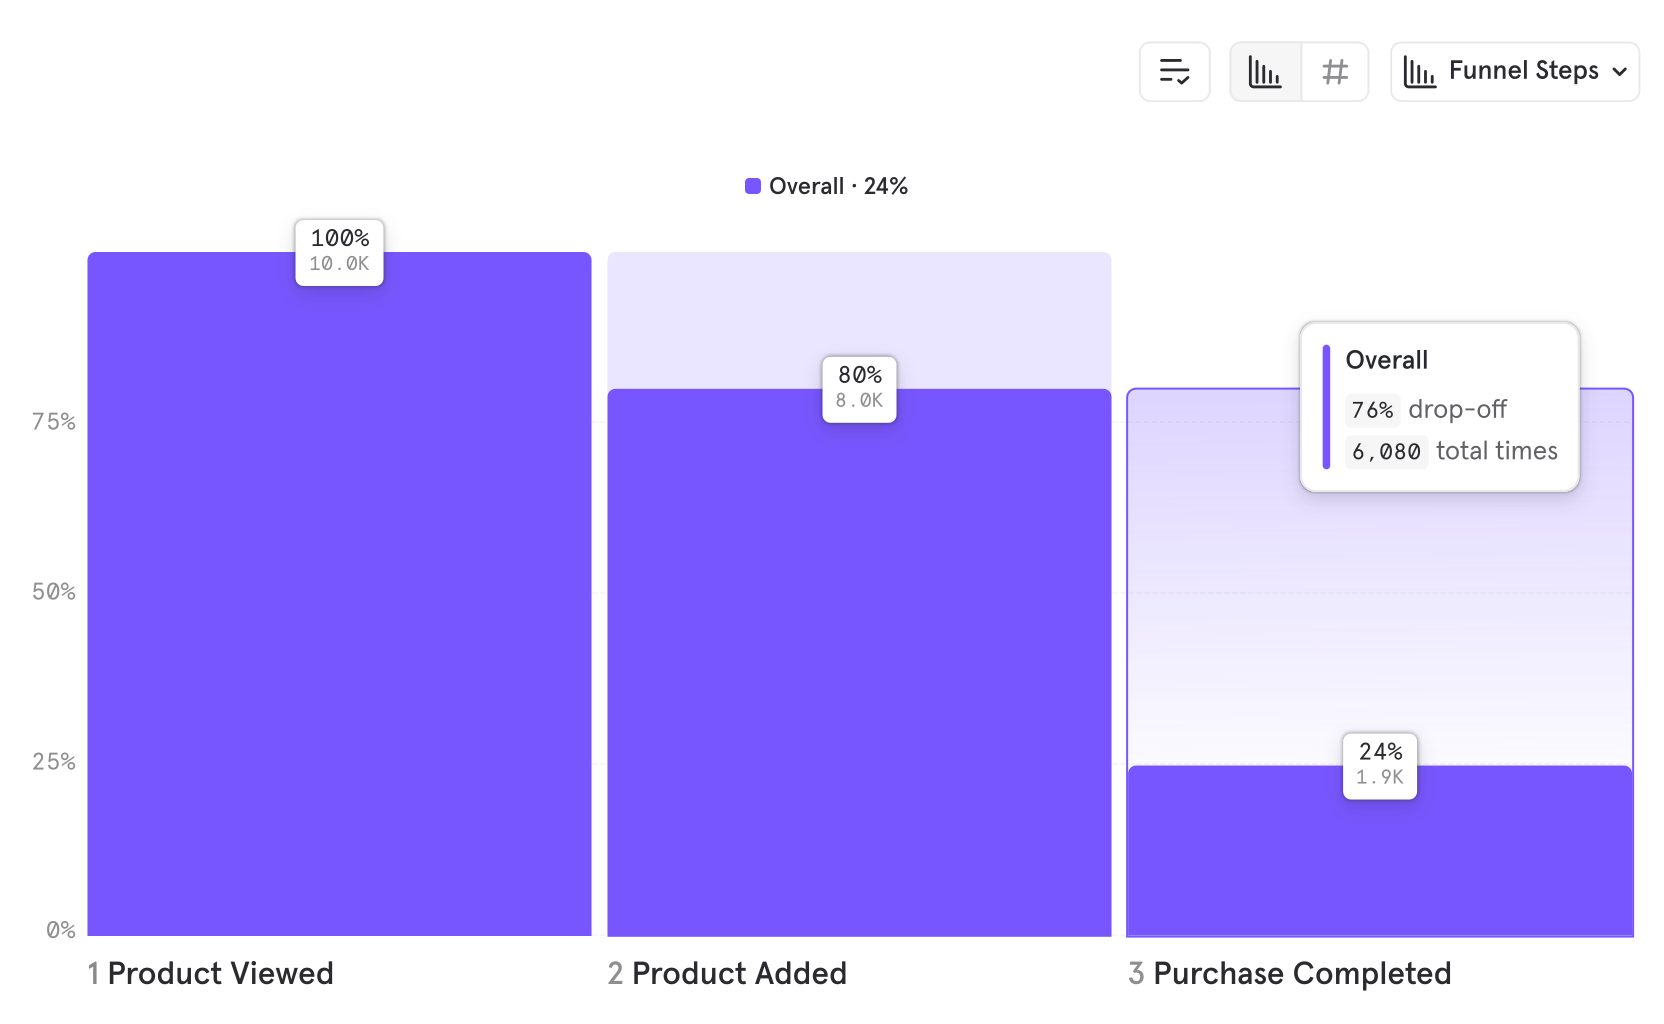
Best suited for: Product and growth teams that need detailed analysis of user actions over time.
Mixpanel concentrates on behavioral analytics.
Its capabilities include funnels, retention analysis, user flows, segmentation, and product-performance reporting.
Although Mixpanel now provides broader website analytics features, its primary differentiation remains the investigation of how users interact with digital products.
Data Retention
Mixpanel’s published pricing documentation identifies a default event-data retention period of two years for new projects, with custom retention options available for qualifying enterprise arrangements.
Historical retention depends on the project’s applicable terms, so teams migrating existing implementations should confirm their actual policy.
Event Modeling and Reporting
Mixpanel is particularly useful when the team has clearly defined product events.
Consider a subscription application with the following journey:
- A visitor signs up.
- The new user creates a workspace.
- The user invites a teammate.
- The workspace completes its first project.
- The account upgrades to a paid subscription.
Mixpanel can help analyze how users move through the funnel and where different cohorts abandon the journey.
For a product-led business, that may be more actionable than another acquisition report.
But it won’t eliminate the need for careful instrumentation.
If the application doesn’t correctly identify an activated account, the retention report will still be misleading.
Pricing
Mixpanel currently offers a free plan with up to 1 million events per month, including access to funnels and retention analysis.
Its Growth plan uses event-volume-based pricing, with Enterprise available through sales.
Our assessment: Mixpanel is well suited to teams that need to understand conversion, retention, and feature usage. It shouldn’t be chosen merely because someone finds GA4’s interface difficult.
9. Digimetrics.ai Fits: Improving GA4 Reporting Without Replacing GA4

Best suited for: SEO specialists, content marketers, and agencies that want to connect website analytics with broader marketing decisions.
Digimetrics.ai takes a different approach from the dedicated analytics platforms above.
Rather than positioning itself as an independent GA4 replacement, Digimetrics provides a broader digital marketing workspace with connected-data tools.
Its published integrations include Google Analytics 4, Google Search Console, Google Ads, Meta Ads, and LinkedIn Ads.
The GA4 integration brings sessions, users, engagement, and conversion information into the Digimetrics workspace.
That makes it relevant to teams whose main complaint isn’t necessarily the data GA4 collects, but the work required to connect analytics with SEO, content, and advertising decisions.
What Digimetrics Can Help With
Consider a content team trying to determine why an article receives substantial organic traffic but generates few inquiries.
GA4 can provide information about traffic, engagement, and conversions. Search Console can provide search impressions, clicks, and query performance.
Digimetrics brings these connected data sources into a broader marketing environment that also includes SEO diagnostics, technical audits, and content-optimisation tools.
This can help marketers investigate performance alongside the recommendations and actions they are already managing.
Its SEO Diagnostics tool is also described as combining keyword opportunities with GA4 and Search Console context.
However, this is not evidence that Digimetrics independently collects website analytics events or resolves GA4’s underlying retention, sampling, or consent limitations.
The Important Limitation
Digimetrics is a GA4 companion, not a direct replacement for GA4’s measurement infrastructure.
If GA4 has stopped retaining certain event-level information, connecting that property to Digimetrics does not automatically restore the deleted data.
Likewise, a connected reporting interface should not be assumed to eliminate sampling, modeling, or measurement restrictions in the underlying source.
Those issues must be evaluated at the data-source level.
Pricing
Digimetrics currently advertises a seven-day free trial, with paid plans starting at $39 per month for Starter, $109 for Pro, and $199 for Expert.
The subscription covers its broader marketing toolkit rather than only its GA4 reporting integration.
Our assessment: Digimetrics is worth considering when a team wants to spend less time moving between analytics and other marketing tools. It is not the appropriate choice if the main objective is to replace GA4’s data collection, change raw-data retention policies, or independently measure website sessions.
Data Retention: What You Actually Need to Compare
Retention is one of the easiest analytics features to misunderstand.
A vendor advertising several years of data history may sound better than GA4’s event-level retention settings. But the comparison isn’t meaningful until you establish what data is being retained.
I’d ask four questions.
Can You Still View Historical Aggregated Reports?
A monthly traffic report from three years ago is not the same as an event-level dataset from three years ago.
If the only requirement is comparing annual pageviews and acquisition trends, aggregated history might be sufficient.
Can You Recalculate Historical Metrics?
Suppose your company changes its definition of an engaged lead.
Can you examine historical events using the new criteria, or are you limited to reports created under the old configuration?
This is where access to raw event data becomes more valuable.
What Happens When You Cancel?
Some services retain complete history only while a subscription remains active.
Others offer exports, but obtaining a usable archive may require additional work.
Check data-export formats, access rights, deletion schedules, and migration options before committing.
Does Retention Differ by Data Type?
Event data, recordings, user profiles, aggregated reports, and audit logs may all have different retention policies.
A platform advertising seven years of events might retain session recordings for a much shorter period.
Don’t buy the longest retention number. Buy the retention policy that supports your actual reporting questions.
Sampling vs. Measurement Accuracy: Don’t Confuse Them
A platform that doesn’t sample its collected events isn’t necessarily measuring every visitor.
Sampling is only one reason analytics numbers may differ.
Other factors include:
- Consent settings and privacy choices.
- Ad blockers and browser restrictions.
- Bot filtering.
- Different session and visitor definitions.
- Event-tracking implementation errors.
- Time-zone differences.
- Attribution rules and conversion windows.
For example, if GA4 reports 8,000 sessions and another platform reports 9,200, the difference doesn’t prove that one product is 15% more accurate.
The tools may be applying different rules to different observable datasets.
A sensible evaluation begins by identifying which numbers should be directly comparable.
Pageview counts for a controlled test page are easier to verify than attributed conversions across multiple marketing channels.
For acquisition and conversion reporting, teams should document the underlying definitions before making judgments about accuracy.
How to Test GA4 Alternatives Before Migrating
A feature comparison tells you what vendors claim their products can do.
A controlled evaluation tells you whether those products solve your team’s problems.
The following is a proposed testing framework, not a completed independent benchmark.
Step 1: Identify Five Recurring Questions
Start with actual reporting requests from your team.
For example:
- Which organic landing pages generated qualified inquiries last month?
- Which advertising campaigns produced the lowest cost per lead?
- Where do users abandon the signup journey?
- How did engagement change after a website redesign?
- Which content topics generate conversions rather than traffic alone?
Write down the question, the metrics required, and the expected output before opening a new analytics dashboard.
Step 2: Establish a Measurement Baseline
Review the existing GA4 implementation.
Check whether important events fire correctly, whether duplicate tracking exists, and whether campaign parameters are consistent.
Use a small set of known actions, such as visiting a test page and submitting a test form, to verify event collection.
Without this baseline, the new platform may be blamed for problems inherited from the existing implementation.
Step 3: Run Both Systems in Parallel
For a practical initial comparison, run GA4 and the candidate platform simultaneously for approximately 14 days.
Use a longer observation period when traffic volume is low or the decisions depend on weekly or monthly behavior.
Compare reporting trends, metric definitions, and the ability to investigate discrepancies rather than expecting identical totals.
Step 4: Measure Time to First Useful Action
This is a metric vendors rarely advertise.
Record the time between opening the platform and completing a meaningful task, such as identifying a poorly converting landing page and deciding what should be investigated next.
Don’t stop the clock when the dashboard finishes loading.
The task ends when the analyst produces an answer that can inform an action.
Measure separately the initial implementation time and the time required for repeat reporting tasks.
Step 5: Score the Results
For a practical evaluation, I’d use the following weighting.
| Criterion | Weight | What It Measures |
|---|---|---|
| Reporting usefulness | 25% | Ability to answer real business questions |
| Data reliability and transparency | 20% | Clear definitions, measurement quality, and limitations |
| Retention and export flexibility | 15% | Availability of historical information and portability |
| Event tracking and analysis | 15% | Suitability for required conversions and behavioral questions |
| Time to first useful action | 15% | Implementation and recurring reporting effort |
| Total operating cost | 10% | Subscription, staffing, infrastructure, and maintenance |
| Total | 100% |
These are suggested evaluation weights, not verified product scores.
Organizations with strict data-residency or regulatory requirements should treat those requirements as mandatory eligibility conditions rather than allowing a high usability score to compensate for noncompliance.
The Metric Vendors Rarely Show: Cost Per Answered Question
Analytics software doesn’t create value merely by collecting events.
It creates value when someone uses the information to make a better decision, identify a problem, or evaluate an improvement.
That’s why subscription price alone is a poor comparison.
An Illustrative Monthly Reporting Scenario
Imagine a marketing team regularly answers 20 distinct reporting questions.
Its existing analytics workflow requires 12 hours of analysis and report preparation each month.
A replacement platform reduces the work to five hours but costs $60 per month.
Assume the internal cost of reporting work is $30 per hour.
| Cost Component | Existing Workflow | Alternative Workflow |
|---|---|---|
| Software subscription | $0 | $60 |
| Reporting labor | $360 | $150 |
| Monthly operating cost | $360 | $210 |
| Questions answered | 20 | 20 |
| Cost per answered question | $18.00 | $10.50 |
Under those assumptions, the alternative saves $150 per month despite its subscription cost.
These figures are hypothetical. They demonstrate the calculation rather than actual vendor performance.
The evaluation should also account for one-time migration, training, and implementation costs.
And the reported savings only matter if the new system answers the same questions to an acceptable standard.
A faster dashboard that cannot measure a critical conversion isn’t necessarily cheaper.
Should You Replace GA4 or Use Another Tool Alongside It?
This is probably the most important decision in the entire comparison.
The answer depends on what’s making GA4 difficult to use.
Replace GA4 When Its Measurement Approach No Longer Fits
An organization focused on privacy-friendly website metrics might prefer a simpler, cookieless analytics implementation.
A company requiring self-hosted analytics may choose Matomo or Umami because deployment control is important.
An enterprise may evaluate Piwik PRO because its data governance requirements justify a specialized platform.
In these situations, the motivation goes beyond an inconvenient reporting interface.
Keep GA4 When the Existing Measurement Is Valuable
GA4 remains useful for teams that depend on Google advertising integrations, established conversion tracking, and their existing analytics infrastructure.
If the problem is simply obtaining readable performance summaries, replacing the collection system may create unnecessary disruption.
A reporting layer, better dashboard design, or a connected marketing workspace could be a lower-risk improvement.
This is where Digimetrics can be evaluated as a complement, rather than a replacement.
Use a Second Analytics Platform for a Specific Gap
Sometimes neither full replacement nor a reporting overlay is the right answer.
A business might keep GA4 for advertising measurement while introducing Plausible or Simple Analytics for separate privacy-focused website reporting.
A SaaS company could retain GA4 for acquisition and use Mixpanel or PostHog to investigate product activation and retention.
That approach introduces extra tools and measurement definitions, but it can be justified when each platform answers a distinct set of questions.
The danger is paying for overlapping dashboards without clear ownership of the resulting metrics.
Which GA4 Alternative Should You Choose?
The most suitable option depends on the primary problem you want to resolve.
| Your Main Requirement | Tools Worth Evaluating |
|---|---|
| Simple traffic and conversion reporting | Plausible, Fathom |
| Privacy-focused independent website measurement | Simple Analytics, Plausible |
| Self-hosting and data control | Matomo, Umami |
| Broader traditional web analytics | Matomo |
| Enterprise governance and deployment | Piwik PRO |
| Product behavior and troubleshooting | PostHog |
| Funnels, cohorts, and product retention | Mixpanel |
| Better connected marketing analysis while keeping GA4 | Digimetrics.ai |
These are use-case recommendations based on documented capabilities, not an independently measured ranking.
Before selecting any platform, confirm that its data model, reporting features, retention policy, and implementation requirements match the questions your organization needs to answer.
Five Mistakes to Avoid When Migrating From GA4
1. Expecting Every Metric to Match
Sessions, visitors, and conversions can be defined differently across platforms.
Treat unexplained discrepancies as something to investigate, not automatic proof that either tool is inaccurate.
2. Ignoring Historical Data
Review what can be exported, what can be imported into the new platform, and what historical detail may be lost.
Exporting aggregated reports is different from retaining a queryable raw dataset.
3. Rebuilding Every Event Without Questioning Its Value
A migration is an opportunity to simplify event tracking.
Identify which events are actually used in reporting and which were added without a clear business purpose.
4. Comparing Subscription Prices Without Usage Limits
Pageviews, events, actions, sites, and users may all affect pricing.
A low entry price can become expensive when a team requires several websites, extensive event tracking, or additional seats.
5. Switching Tools Before Fixing the Measurement Plan
A new analytics platform won’t automatically repair inconsistent event naming, duplicate tags, missing consent configuration, or poorly defined conversions.
Resolve those problems before treating migration as the solution.
Our Review Methodology and Limitations
This comparison is based on official product documentation, published plan information, and the stated measurement and reporting approaches of the products covered.
We focused on four central dimensions: data retention, sampling and measurement transparency, event modeling, and reporting usability. We also considered implementation complexity, cost, and time to first useful action.
We have not presented measured accuracy scores, installation times, or comparative performance results because a standardized hands-on test across the eight platforms has not been completed for this article.
The proposed scoring framework is intended to make future evaluations reproducible.
A completed comparative benchmark should publish its test environment, tracking configuration, event definitions, report queries, observed differences, and reviewer decisions.
Final Verdict: Fix the Measurement Problem Before Replacing the Platform
GA4 alternatives have become increasingly specialized.
Some simplify website reporting. Others provide greater control over collected data, while product analytics platforms help teams understand how users move through a digital experience.
Those differences are more important than the size of a feature list.
If your biggest complaint is that GA4 makes a simple traffic report unnecessarily difficult, Plausible or Fathom may be worth evaluating.
If you need more control over data storage, Matomo or Umami might make sense. Enterprise requirements may justify Piwik PRO, while product-led businesses should consider PostHog or Mixpanel.
And if GA4 is already collecting useful information but your team struggles to connect that information with SEO, content, and advertising decisions, a connected platform such as Digimetrics may be worth assessing before undertaking a full migration.
The right analytics platform isn’t the one that collects the most data. It’s the one that gives your team enough trustworthy information to make the next decision, without creating unnecessary work.
Before paying for another subscription, identify the questions you can’t currently answer, measure how long those answers take, and determine whether the new product addresses that gap.
Sometimes the right decision is to switch.
Sometimes it’s to add a specialized tool.
And sometimes the most effective GA4 alternative is simply a better way to use the data you’re already collecting.
Analytics needs vary considerably between businesses. For further comparisons covering measurement, reporting, and marketing dashboards, explore our Analytics & Reporting guides.
Frequently Asked Questions
What Is the Best Alternative to Google Analytics 4 in 2026?
There isn’t one best option for every organization. Plausible and Fathom are suited to simpler website reporting, Matomo offers broader analytics and data-control options, and PostHog or Mixpanel may be more appropriate for product behavior analysis.
The right choice depends on your measurement needs rather than the number of advertised features.
Is There a Free GA4 Alternative?
Yes. Umami, PostHog, and Mixpanel offer free cloud plans with usage or retention limits. Matomo and Umami also provide self-hosting options, although running the software creates infrastructure and maintenance costs.
Which GA4 Alternatives Don’t Use Data Sampling?
Matomo states that its analytics reports don’t use sampling. Plausible doesn’t sample by default but documents limited sampling in certain large dashboard views. Piwik PRO uses full collected data by default and offers optional sampling controls.
Check the specific report and data-volume limitations rather than relying on a general no-sampling claim.
Is GA4 Data Deleted After 14 Months?
Not all GA4 data.
Standard properties generally allow two or 14 months of event-level and user-level retention, while standard aggregated reports are not governed by that same setting.
Organizations can also use BigQuery exports to retain raw events separately, subject to applicable limits and costs.
Can You Keep GA4 and Use Another Analytics Tool?
Yes. Running two tools can be useful when they serve different purposes.
For example, a company might use GA4 for advertising analysis and PostHog for product behavior, or pair GA4 with a cookieless analytics tool to obtain an independent website traffic baseline.
Is Digimetrics.ai a GA4 Alternative?
Not in the sense of independently replacing GA4’s website tracking.
Digimetrics connects to GA4 and other marketing data sources, allowing teams to review analytics information alongside SEO and marketing workflows.
It is better evaluated as a reporting and marketing-analysis companion.
Will Switching From GA4 Fix Inaccurate Conversion Tracking?
Not necessarily.
If events fire incorrectly, conversion definitions are inconsistent, or campaign tracking is incomplete, a different platform may produce similarly unreliable information.
Audit the measurement implementation before changing software.
How Long Should You Test a GA4 Alternative?
Two weeks can provide a useful initial comparison for active websites, but a longer test may be needed for low-traffic properties, monthly reporting cycles, or complex conversion journeys.
Run both platforms in parallel and verify important events before making a migration decision.
Do Privacy-Friendly Analytics Tools Automatically Guarantee Legal Compliance?
No. Privacy-friendly collection methods can reduce certain risks, but compliance depends on the implementation, information processed, contractual arrangements, and applicable laws.
Review your actual configuration and legal obligations rather than assuming a tool removes every consent or privacy requirement.
Disclosure: digitalmarketingtools.ai is sponsored by Digimetrics.ai. Sponsored Highlights are clearly labelled advertising. Our reviews, comparisons and guides are written to be useful and fair regardless of who sponsors the site. Read the full disclosure.