What Is a GEO Analytics Tool? Metrics, Features, and How to Measure AI Search
Your website ranks for important keywords, organic traffic is stable, and Google Search Console shows that your content is being discovered. But when someone asks ChatGPT to recommend products in your industry or uses Google AI Mode to compare services, you have little visibility into whether your business appears in the response.
Traditional SEO reports only explain part of that experience. A brand can be mentioned in an AI-generated answer without receiving a website visit, while a useful article can appear as a cited source even when the publisher’s name isn’t explicitly recommended.
This creates a new measurement challenge for marketers. How do you determine whether your brand appears in relevant AI-generated answers, which competitors receive attention, and whether that visibility contributes to meaningful business outcomes?
A GEO analytics tool is software that measures and analyses how brands, websites, and content appear within AI-generated search experiences. Depending on the platform, it can collect information about brand mentions, source citations, relevant prompts, competitor visibility, historical changes, and other Generative Engine Optimization (GEO) signals.
However, GEO analytics doesn’t work exactly like conventional website analytics. Some measurements come directly from search platforms, while others are based on selected questions and sampled AI responses. These datasets have different limitations and shouldn’t be treated as interchangeable.
This guide explains how GEO analytics works, which metrics matter, how current platforms compare, and how to build a reporting process that connects AI visibility research with SEO and business performance.
Key Takeaways
- GEO analytics measures visibility within AI-generated answers, including brand mentions, source citations, competitors, and relevant questions.
- First-party and third-party data serve different purposes. Google Search Console provides generative-AI impression reporting, Bing Webmaster Tools reports citation activity, and specialist GEO platforms monitor selected AI responses.
- GEO visibility scores aren’t universal metrics. Different products use different prompts, collection methods, denominators, and calculation models.
- Brand mentions and citations should be reported separately. A company can receive a recommendation without a link, while its website can be cited without a brand recommendation.
- A useful GEO dashboard connects three layers: AI visibility, measurable website activity, and business outcomes.
- The strongest GEO analytics tools preserve the original evidence, including prompts, generated responses, cited URLs, collection dates, and relevant platform settings.
- GEO analytics supports decisions, not guaranteed rankings. Its purpose is to identify meaningful information gaps and investigate changes, rather than maximise an arbitrary visibility score.
What Is a GEO Analytics Tool?
A GEO analytics tool helps businesses understand how they are represented within AI-assisted discovery experiences.
Traditional analytics platforms typically focus on activity occurring on a website or within conventional search results. They can show impressions, clicks, sessions, conversions, and other performance measurements.
GEO analytics examines another part of the customer research process: what happens when an AI system generates an answer about a product, service, industry, or question.
For example, a company selling accounting software might want to understand whether its brand appears when someone asks:
“Which accounting tools are suitable for small businesses with remote employees?”
A GEO analytics tool could record whether the generated response mentions the company, which competitors appear, what sources are cited, and how those observations change across repeated checks.
The resulting information can help marketers investigate whether their product documentation, comparisons, and other published material support the questions customers are asking.
However, these observations don’t necessarily represent every answer generated for real users. Most third-party platforms monitor a defined collection of prompts or analyse previously collected response datasets.
GEO analytics should therefore be understood as a combination of visibility monitoring, source analysis, competitive research, and performance measurement, with clear limits on what each dataset can establish.
For a broader introduction to the category, see our complete guide to GEO tools, which explains the relationship between GEO software, AI search visibility, citations, and established SEO practices.
How Is GEO Analytics Different From Traditional SEO Analytics?

SEO and GEO analytics overlap because both help marketers understand how people discover information through search-related experiences.
However, they don’t measure the same events.
Traditional SEO reporting can show how often a page appears in supported search results, its average position, and the clicks or traffic associated with that visibility.
GEO analytics can investigate whether an AI-generated answer mentions a brand, presents a website as a source, or includes competing businesses in a product comparison.
These measurements may relate to the same customer journey, but one cannot automatically replace the other.
| Measurement Area | Traditional SEO Analytics | GEO Analytics |
|---|---|---|
| Primary focus | Search visibility and website performance | Brand and source visibility within AI-generated answers |
| Typical measurements | Rankings, impressions, clicks, organic traffic | Mentions, citations, prompt coverage, competitor visibility |
| Unit of analysis | Keyword, URL, search result, session | Prompt, generated response, brand, cited source |
| Competitive research | Search rankings and competing pages | Brands and sources appearing in monitored AI answers |
| Historical analysis | Ranking and traffic changes | Changes in observed AI responses |
| Business measurement | Organic visits and conversions | AI-related visibility combined with attributable visits and outcomes |
| Main limitation | Doesn’t fully describe AI-generated brand recommendations | Sampled observations don’t establish total audience exposure |
For instance, an article could rank prominently for a particular keyword while receiving relatively few citations within a monitored set of AI-generated responses.
Conversely, an independent publication might receive source citations in AI answers even when its article isn’t the highest-ranking organic result for a related search.
These outcomes aren’t necessarily contradictory. They reflect different measurements collected under different conditions.
Our article on why GEO and SEO measure different signals explores why the two approaches should complement rather than replace each other.
How Does a GEO Analytics Tool Work?
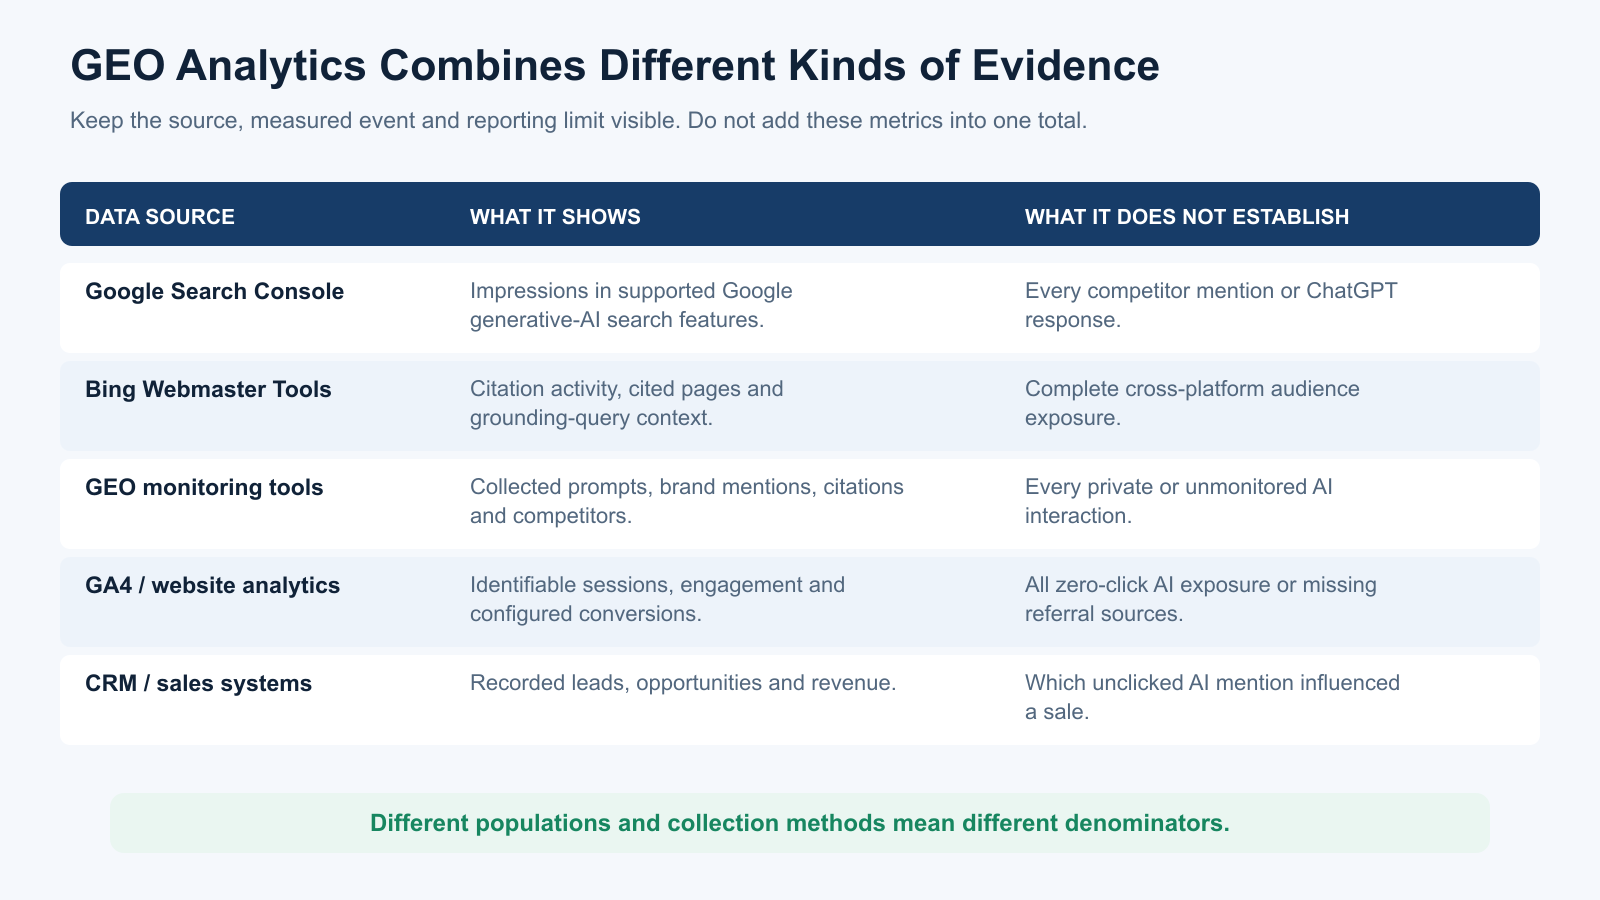
Most GEO analytics platforms collect information from one or more of three sources: first-party search reports, monitored AI-generated responses, and website analytics.
Some products combine these sources within one interface. Others concentrate on a particular measurement category, such as brand mentions or cited URLs.
Understanding where the information comes from is important because it determines which claims the resulting dashboard can support.
1. First-Party AI Search Reporting
First-party data comes directly from a platform reporting activity within its own supported experiences.
Google Search Console and Bing Webmaster Tools are important examples.
Google’s dedicated generative-AI performance reports provide impression measurements for verified websites appearing within supported generative features on Google Search.
Microsoft’s AI Performance reporting provides citation-related information for verified websites across supported Microsoft AI experiences.
These reports describe different types of activity, but they have an important advantage: they originate from the platforms operating the relevant search experiences.
However, neither provides a complete cross-platform view of how every AI assistant describes your brand or competitors.
2. Third-Party Prompt Monitoring
Specialist GEO tools commonly monitor selected questions across supported AI search experiences.
A business might configure prompts related to product recommendations, industry comparisons, technical problems, and competing services.
The software collects generated responses and analyses whether they contain the monitored brand, competing products, or relevant source citations.
For example, a software company could track twenty commercially important questions across ChatGPT Search and Perplexity.
The collected responses might reveal that its product appears frequently in integration-related questions but rarely in comparisons aimed at beginners.
That information could support product positioning or content research, although it would represent the monitored questions rather than every customer interaction.
3. Website and Business Analytics
The third layer examines what happens after someone visits a website.
Google Analytics 4 (GA4), other website analytics systems, and customer relationship management platforms can provide information about attributable sessions, engagement, enquiries, and conversions.
Some AI-originated visits may be identifiable through referral information or URL parameters.
However, a person might encounter a brand inside an AI answer and never click through. They could also visit the website later through another channel.
Consequently, website analytics cannot measure every possible effect of an AI-generated recommendation.
How These Data Sources Fit Together
| Data Source | Evidence Provided | What It Cannot Fully Explain |
|---|---|---|
| Google Search Console | Impressions for supported Google generative-AI features | Every competitor mention or ChatGPT response |
| Bing Webmaster Tools | Citations, cited pages, grounding queries, and trends | Complete cross-platform audience exposure |
| GEO monitoring platforms | Collected prompts, mentions, citations, competitors | Every private or unmonitored AI interaction |
| GA4 and website analytics | Identifiable sessions, engagement, and conversions | All zero-click AI brand exposure |
| CRM and sales systems | Leads, opportunities, and revenue | Which unclicked AI mention influenced a customer |
A useful GEO analytics strategy combines these measurements without pretending that they describe the same population.
Which GEO Analytics Metrics Actually Matter?
GEO dashboards often contain visibility scores, share-of-voice percentages, estimated impressions, and citation trends.
These measurements can be useful, but only when their definitions are understood.
A metric should answer a particular business question and provide enough underlying evidence for the team to investigate the result.
Brand Mentions
Brand mention tracking measures whether a company or product is named within a collected AI response.
For example, an AI assistant could include your software in a list of tools for small businesses.
That counts as a brand appearance under many monitoring systems, but it doesn’t automatically mean the assistant recommended your product.
A response may mention a brand neutrally, criticise it, or describe it as unsuitable for a particular requirement.
Accurate GEO analytics should therefore provide access to the original response and, where available, information about its context.
Prompt Coverage
Prompt coverage measures how often a brand appears across a defined set of monitored responses.
This can help determine whether the brand is consistently present for relevant questions or appears only occasionally.
However, coverage depends heavily on prompt selection.
A business monitoring only branded questions may report high visibility, while a more balanced set of non-branded product comparisons could produce a very different result.
Coverage should always be reported alongside the sample size and collection method.
Citation Frequency and Citation Coverage
Citation tracking measures when a website or individual page appears as a source within generated answers.
A citation can provide useful evidence that a particular resource is being referenced.
However, a citation isn’t equivalent to a brand recommendation, a conventional backlink, or a website visit.
Counting methods also differ. Some platforms count cited pages, while others count distinct domains or responses containing a citation.
For example, Ahrefs Brand Radar distinguishes visible citations from pages retrieved during answer generation but not cited in the final response.
A GEO dashboard should preserve these distinctions rather than combining them into an unexplained source count.
Our AI citation tracking tools guide explains these measurements in greater detail.
AI Share of Voice
AI share of voice describes a brand’s relative visibility compared with selected competitors.
However, there isn’t one universal formula used by every GEO platform.
Peec AI describes share of voice in relation to brand mentions within its monitored responses, while Ahrefs uses a comparative measure based on estimated impressions.
These approaches can both provide useful information, but the percentages shouldn’t be compared directly as though they represent identical measurements.
Always verify the vendor’s denominator, prompt coverage, competitor set, and weighting method.
Brand Sentiment and Recommendation Context
Sentiment analysis attempts to classify how an AI system describes a business.
Some platforms use positive, neutral, and negative categories, while others assign numerical scores.
For example, an assistant may describe a software product as affordable but lacking advanced integrations.
A simple positive sentiment label might overlook the limitation, while a negative label could ignore the product’s affordability advantage.
Sentiment can help identify responses worth reviewing, but the underlying text should determine how important the finding is.
First-Party AI Impressions
An AI impression describes visibility within a platform’s supported reporting environment.
Google Search Console’s generative-AI report measures appearances of website links in supported Google AI search features.
This is fundamentally different from a third-party platform estimating how many people might encounter a brand through selected prompts.
First-party impressions are useful evidence of reported exposure within the relevant Google experiences. They aren’t a complete measurement of visibility across ChatGPT, Gemini, Perplexity, and every other AI platform.
AI Referral Traffic and Conversions
Referral traffic measures identifiable visits arriving from another platform.
GA4’s Traffic Acquisition report can help marketers investigate session sources and how those visitors engage with a website.
However, not every AI-originated visit will be attributed correctly. Referral information may be missing, and some visits may be classified as direct traffic.
Even when traffic is identifiable, the visit itself doesn’t establish that the user became a customer.
For that reason, GEO performance analysis should connect attributable visits with relevant events, enquiries, or other business outcomes where the data allows.
Example: Calculating GEO Visibility From Monitored Responses
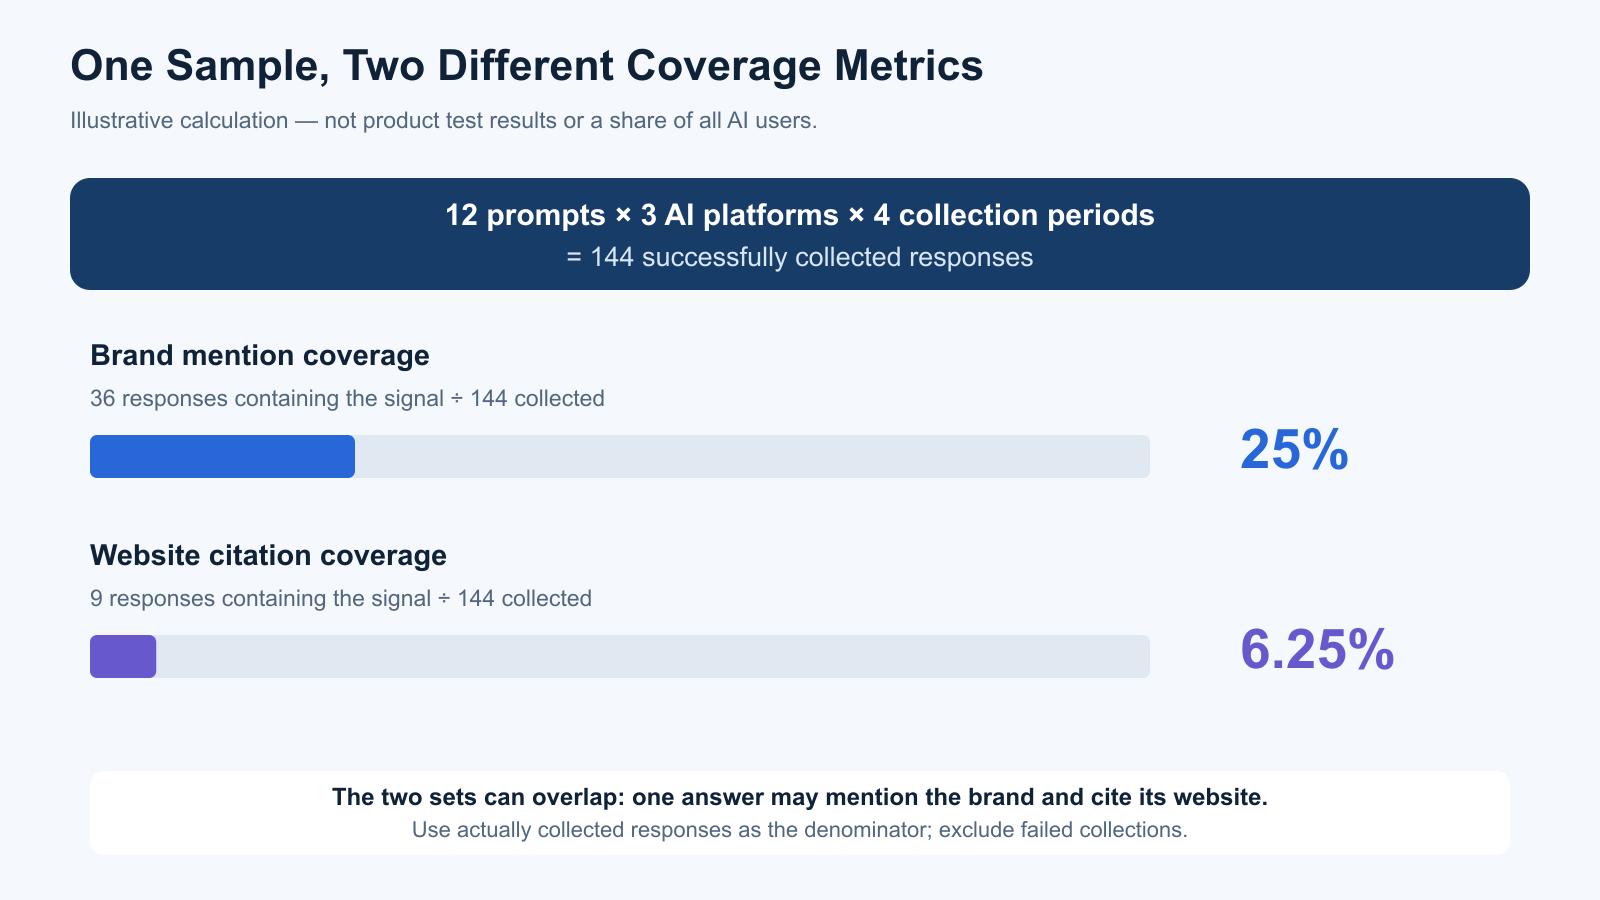
Consider a hypothetical software company evaluating its brand presence across three AI search experiences.
The company monitors twelve relevant prompts on each platform over four collection periods.
Assuming every scheduled response is successfully collected, that creates:
12 prompts × 3 AI platforms × 4 collections = 144 observed responses
The tracking results show that the brand appeared in 36 responses, while the company’s domain was visibly cited in nine.
| Measurement | Hypothetical Result |
|---|---|
| Prompts monitored | 12 |
| AI platforms | 3 |
| Collection periods | 4 |
| Total responses collected | 144 |
| Responses mentioning the brand | 36 |
| Responses citing the website | 9 |
| Observed brand mention coverage | 25% |
| Observed website citation coverage | 6.25% |
Brand mention coverage = 36 ÷ 144 × 100 = 25%
Citation coverage = 9 ÷ 144 × 100 = 6.25%
These figures are illustrative, not results from a product benchmark.
They describe the proportion of collected responses containing the brand or a visible citation. They don’t establish that 25% of all AI users encountered the company.
The values also shouldn’t be treated as mutually exclusive. Some of the nine cited responses might be among the 36 responses mentioning the brand.
Why Sample Size and Prompt Selection Matter
Suppose half the monitored questions specifically name the company.
The resulting mention coverage would be difficult to interpret as evidence of broader market awareness.
A more balanced sample would include informational questions, non-branded product comparisons, problem-solving prompts, and a limited number of branded questions.
The report should also preserve platform-level and topic-level results rather than relying entirely on an overall average.
For example, a company might appear in most monitored responses on one AI platform but very few on another.
That distinction could reveal differences worth investigating.
Why GEO Scores Can Be Misleading
Two products can report different visibility percentages without either necessarily being incorrect.
They may use different prompt databases, brand-matching rules, collection dates, geographic settings, or weighting formulas.
One tool might also count every brand-name occurrence, while another counts each response containing the brand only once.
Before interpreting a visibility score, establish what was measured and whether the methodology remained consistent.
For businesses evaluating multiple vendors, the underlying responses are more useful than comparing proprietary scores without context.
What Should a GEO Analytics Dashboard Include?
A practical GEO analytics dashboard should help the team understand what happened, investigate the evidence, and decide whether any action is warranted.
It doesn’t need to display every available metric.
For most marketing teams, the clearest reporting structure separates GEO performance into three layers.
Layer 1: AI Search Visibility
This section describes where the brand or website appears within relevant AI-generated experiences.
Useful indicators may include monitored response coverage, brand mentions, cited URLs, competing brands, and changes across collection periods.
The dashboard should allow users to filter the information by platform, topic, geographic market, or collection date where those dimensions are supported.
Most importantly, it should provide access to the actual responses or cited pages behind the figures.
Layer 2: Website Activity
The next section describes measurable activity arriving at the website.
This can include AI referral sessions, relevant landing pages, engagement metrics, and changes in attributable visits.
However, the team should avoid describing every visit from a search platform as a direct result of a particular monitored AI answer.
The monitoring dataset and actual visitor dataset may describe different people and interactions.
Layer 3: Business Outcomes
The final section examines the outcomes the business ultimately cares about.
For an ecommerce store, those might include purchases and revenue. For a service provider, the relevant outcomes could be qualified enquiries or bookings.
Where attribution is available, the dashboard can help identify measurable business activity associated with AI-related traffic.
However, zero-click brand exposure and later cross-channel interactions may not be fully attributable.
A practical report should acknowledge that limitation rather than invent a precise revenue value for every AI mention.
Example GEO Analytics Reporting Dashboard
| Reporting Layer | Primary KPI | Supporting Evidence | Reporting Question |
|---|---|---|---|
| Visibility | Mention coverage | Prompts and AI responses | Are we appearing for relevant questions? |
| Source visibility | Citation coverage | Cited domains and URLs | Which of our pages appear as sources? |
| Competitive context | Relative visibility | Competitor appearances and response text | Where do competing brands appear? |
| First-party search | AI impressions and citations | Search Console and Bing reporting | Is our content appearing in supported AI search features? |
| Website activity | Attributable AI sessions | GA4 traffic acquisition | Are measurable visitors arriving? |
| Business outcomes | Leads or purchases | Analytics and CRM records | Does attributable activity support business goals? |
The advantage of this framework is that it prevents a visibility metric from being presented as an actual conversion measurement.
Free GEO Analytics: What Can You Measure Without Paying?
Businesses can begin GEO measurement without immediately purchasing a dedicated platform.
Google Search Console and Bing Webmaster Tools now provide useful first-party reporting, although their data describes different types of activity.
Google Search Console Generative AI Performance
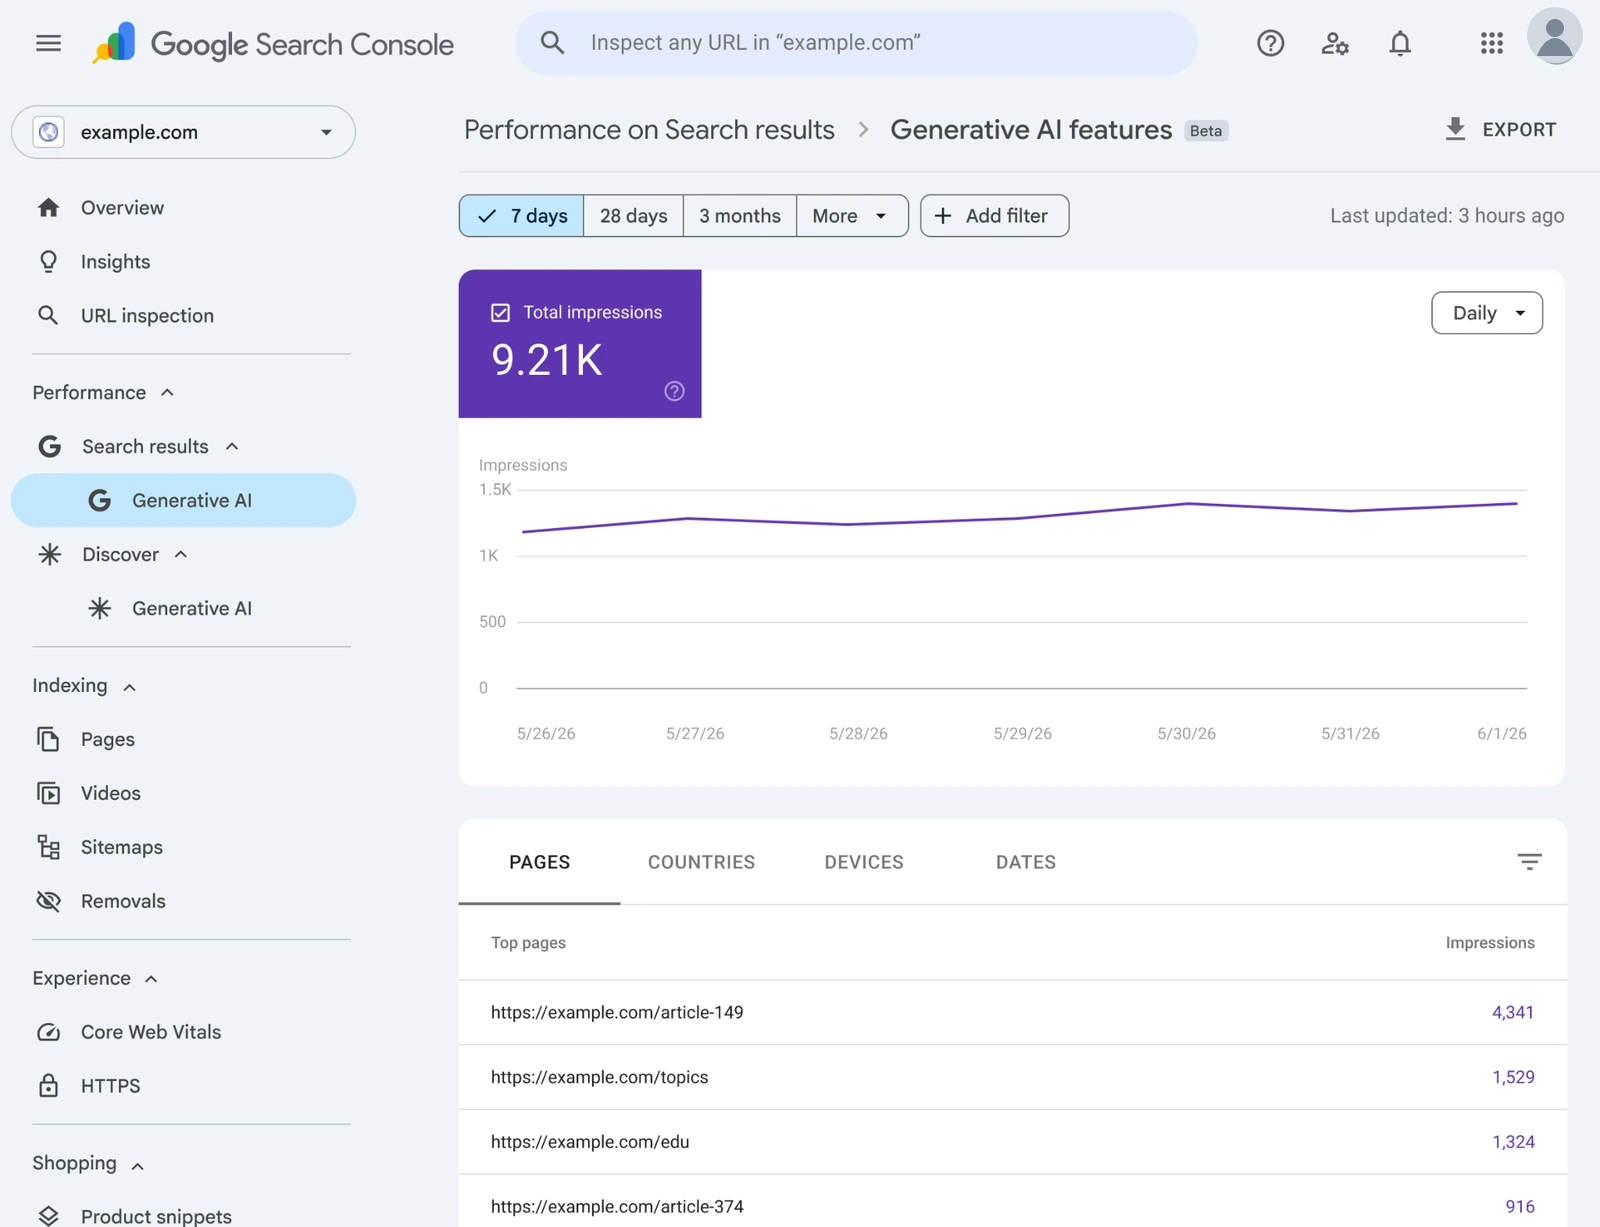
Google introduced dedicated generative-AI performance reports in June 2026 and completed their worldwide rollout by August 31.
The Generative AI performance report for Search covers impressions from supported Google AI search experiences, including AI Overviews and AI Mode.
Website owners can examine the data by page, country, device, and date.
This is useful when a business wants to identify which URLs appear within Google’s supported generative features and how that visibility changes over time.
However, the report doesn’t provide a complete list of all competing brands mentioned in AI answers. It also doesn’t represent every interaction occurring across Google’s wider AI products.
For businesses already using Search Console, this is a sensible first-party starting point.
Bing Webmaster Tools AI Performance
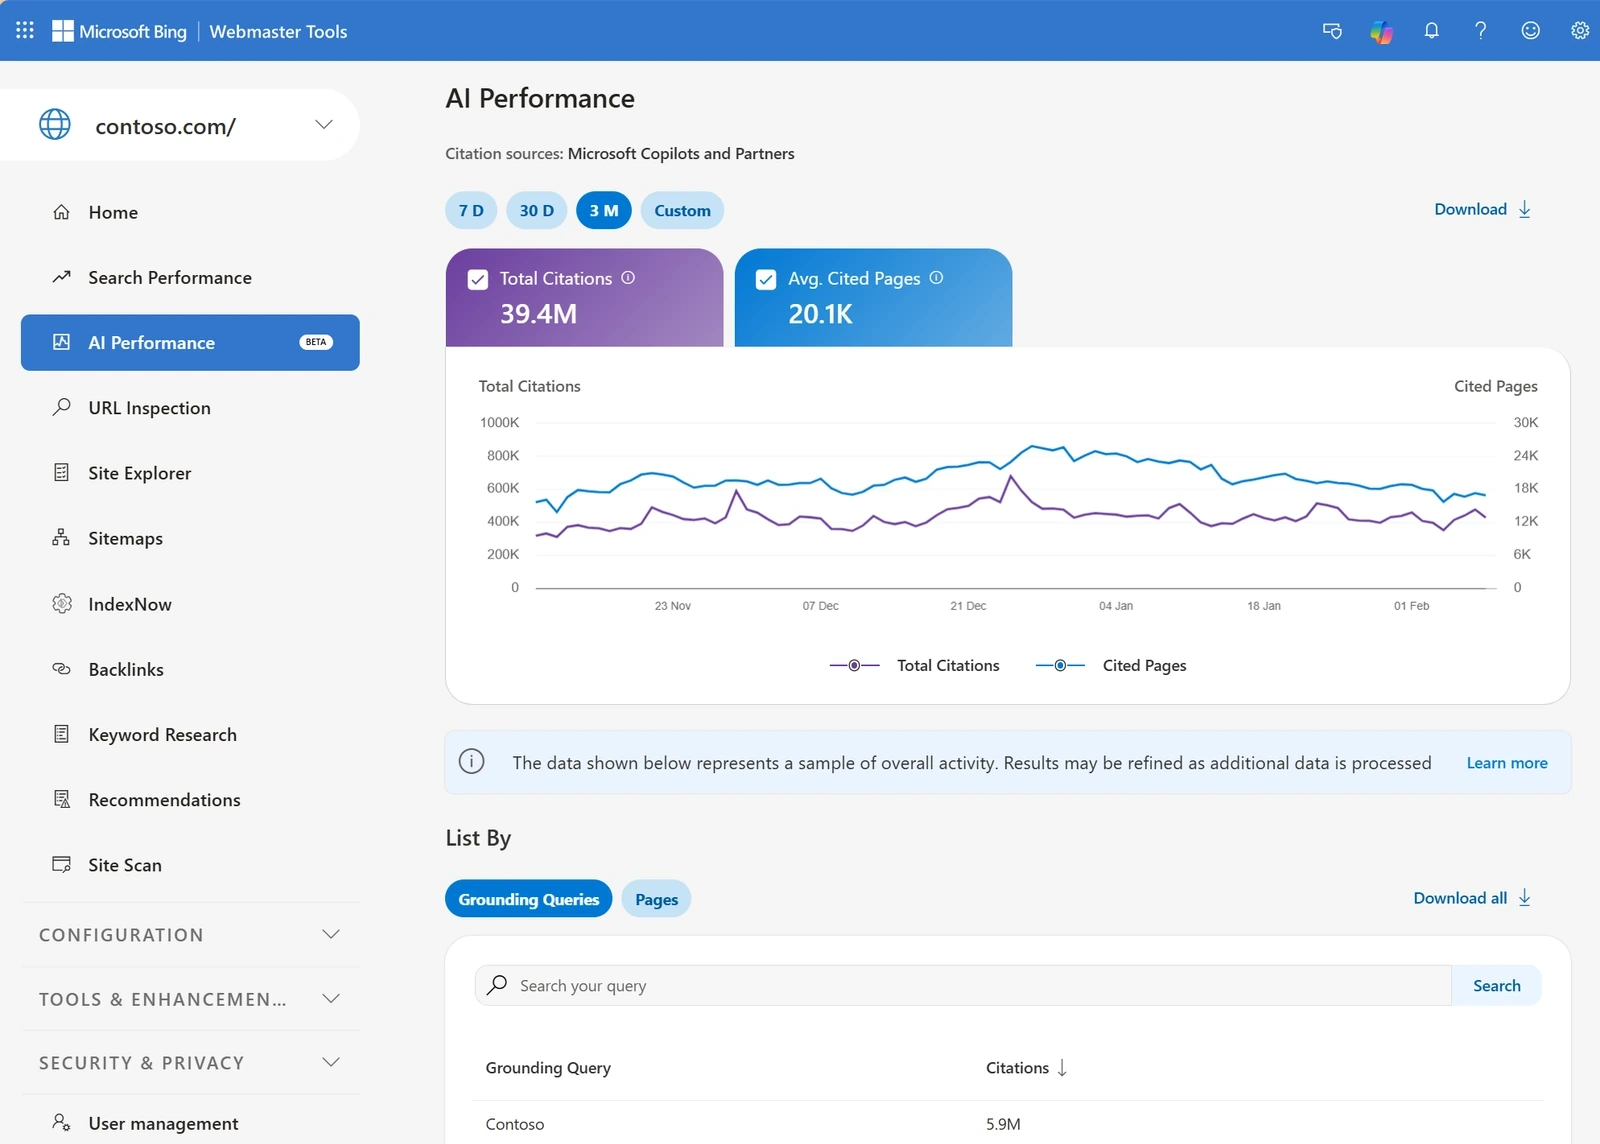
Microsoft introduced its AI Performance report in February 2026.
The report provides information about citation activity for verified websites across supported Microsoft AI experiences.
Its documented measurements include total citations, cited pages, grounding queries, and historical citation trends.
Grounding queries deserve particular attention. They represent phrases associated with information retrieval, not necessarily the exact questions submitted by users.
Microsoft also notes that some of the reporting is based on sampled activity.
In October 2026, Microsoft introduced Topics Portfolio beta, which groups related grounding queries into broader topics and highlights possible content opportunities.
The topic classifications and ecosystem estimates are directional rather than exact measurements.
For publishers, this reporting can help identify where articles are being referenced and which topics warrant further investigation.
Google Analytics 4
GA4 provides another part of the GEO measurement process.
Its Traffic Acquisition reporting can show identifiable session sources and engagement information, while configured key events help connect activity with business outcomes.
For example, a business might investigate whether visits from identifiable AI referrers reach important product pages or generate enquiries.
However, GA4 doesn’t provide an inventory of every brand mention occurring inside AI assistants.
Traffic attribution is also imperfect. Some AI-originated visits may lack sufficient referral information to be classified accurately.
For this reason, website analytics should complement GEO monitoring rather than be presented as a replacement for it.
GEO Analytics Tools Worth Comparing
Several products offer GEO analytics capabilities, but they differ in the data they collect and the reporting workflows they support.
The comparison below focuses on documented functionality as of October 2026. It isn’t a head-to-head test of measurement accuracy.
| Tool | Main Analytics Focus | Useful For |
|---|---|---|
| Google Search Console | First-party generative-AI impressions | Measuring supported Google AI search visibility |
| Bing Webmaster Tools | First-party citation and grounding query reporting | Understanding Microsoft AI source visibility |
| Otterly.AI | Prompt-based brand, citation, sentiment, and competitor monitoring | Recurring AI visibility reporting |
| Peec AI | Brand visibility, share of voice, sentiment, and position | Competitor and brand perception analysis |
| Ahrefs Brand Radar | Mentions, citations, estimated impressions, and AI share of voice | Broader brand and source research |
| Semrush AI Visibility Toolkit | Visibility benchmarks, prompt tracking, sentiment, and competitors | Teams combining SEO and GEO research |
| Digimetrics | AI mention analysis connected to SEO and marketing tools | Integrated GEO and marketing workflows |
Otterly.AI
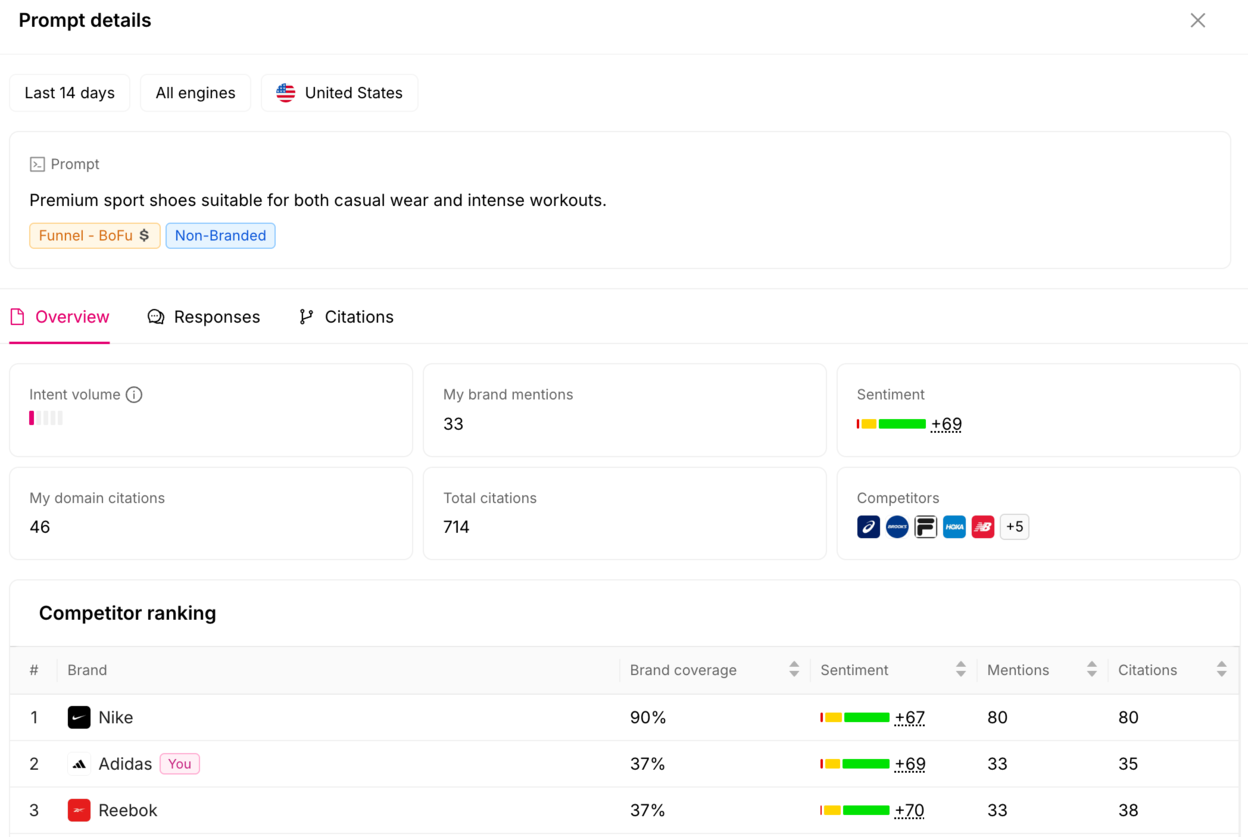
Otterly.AI provides AI search analytics based on monitored prompts across supported AI platforms.
Its documented capabilities include brand mentions, citation tracking, sentiment, share of voice, competitor comparisons, and daily response collection.
Otterly also provides export and integration options that can support recurring reporting.
This makes it relevant for teams that want to monitor a defined set of important customer questions over time.
However, the value of its results depends on whether those questions, platforms, and geographic markets represent the business’s actual research needs.
Peec AI
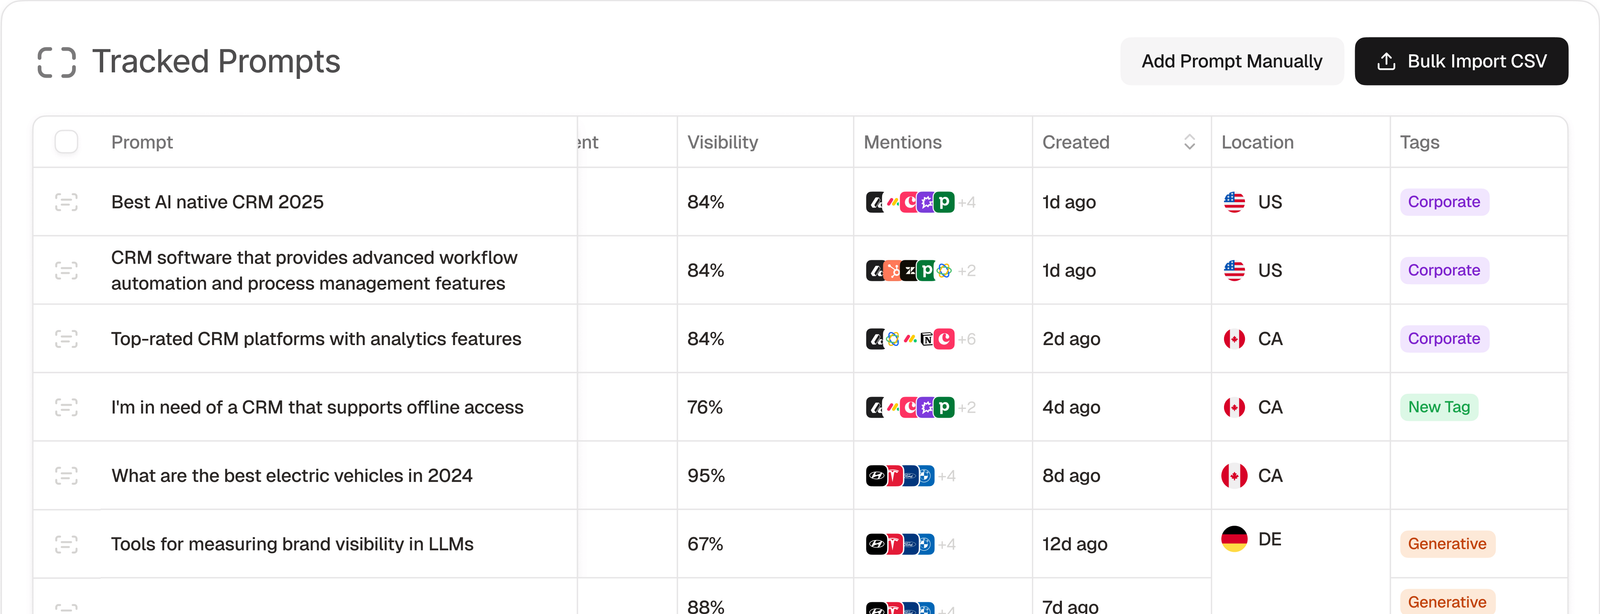
Peec AI focuses on how brands are represented within AI-generated answers.
Its reporting includes visibility percentages, average position, sentiment, and share of voice across monitored prompts.
Peec also provides source information, allowing users to investigate publications and pages appearing within relevant answers.
This can be useful for businesses interested in both brand perception and competing sources.
However, an average brand appearance position isn’t equivalent to an organic Google ranking, and its visibility percentages should be interpreted using the provider’s definitions.
Ahrefs Brand Radar
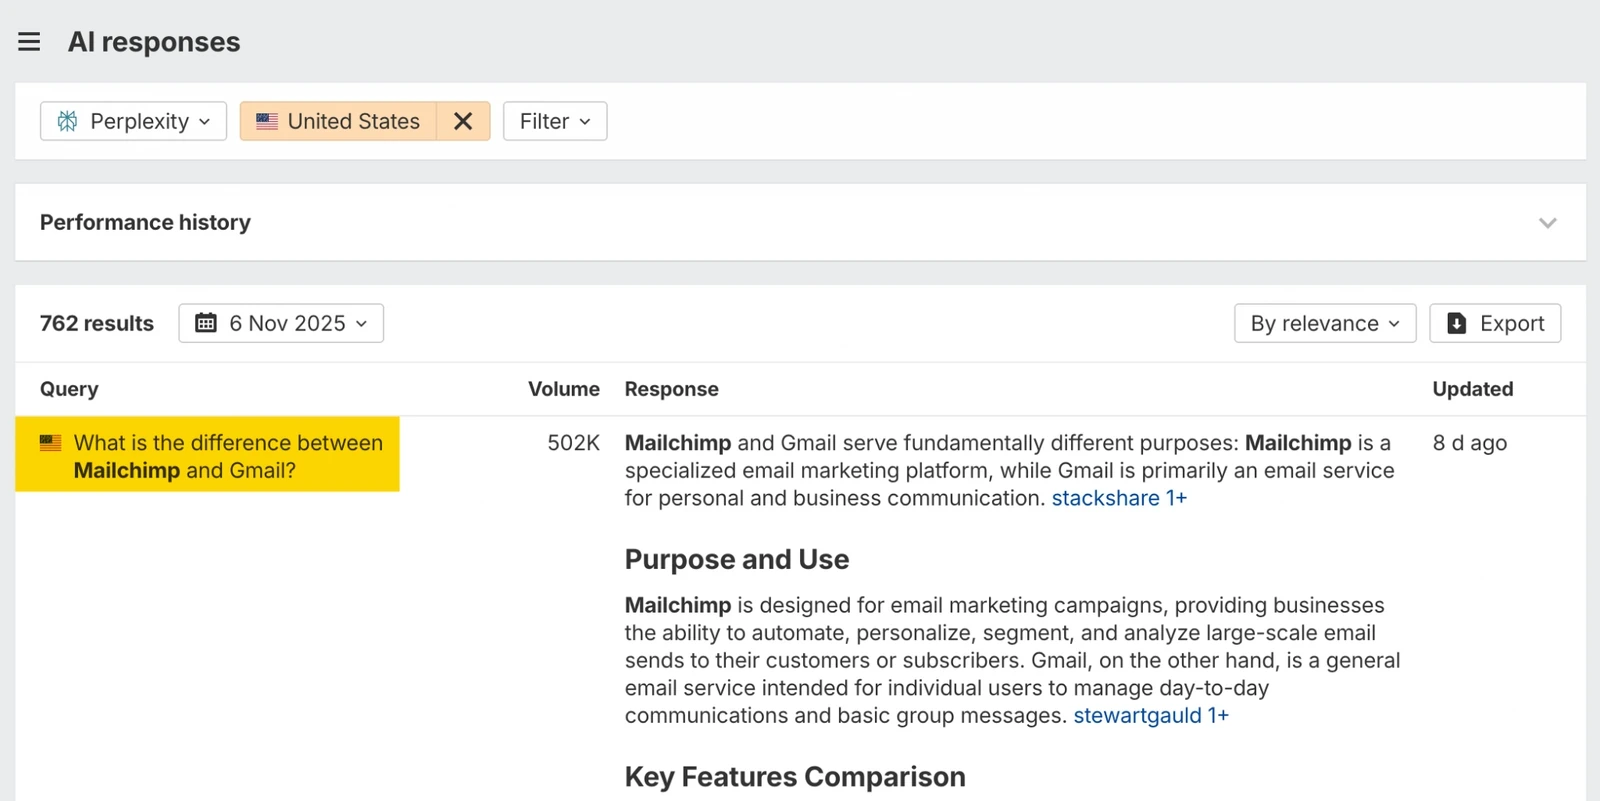
Ahrefs Brand Radar offers AI visibility research covering brand mentions, citations, competitors, and estimated impressions.
Its documentation provides unusually useful detail about metric definitions.
For example, Ahrefs distinguishes a page visibly cited in an AI answer from a page encountered during retrieval but not displayed as a citation.
It also calculates estimated impressions using search-volume-related modelling rather than presenting them as directly recorded audience exposure.
For businesses already using Ahrefs for SEO research, Brand Radar may provide relevant additional context.
However, its modelled audience estimates should not be confused with first-party impressions reported directly by a search platform.
Semrush AI Visibility Toolkit
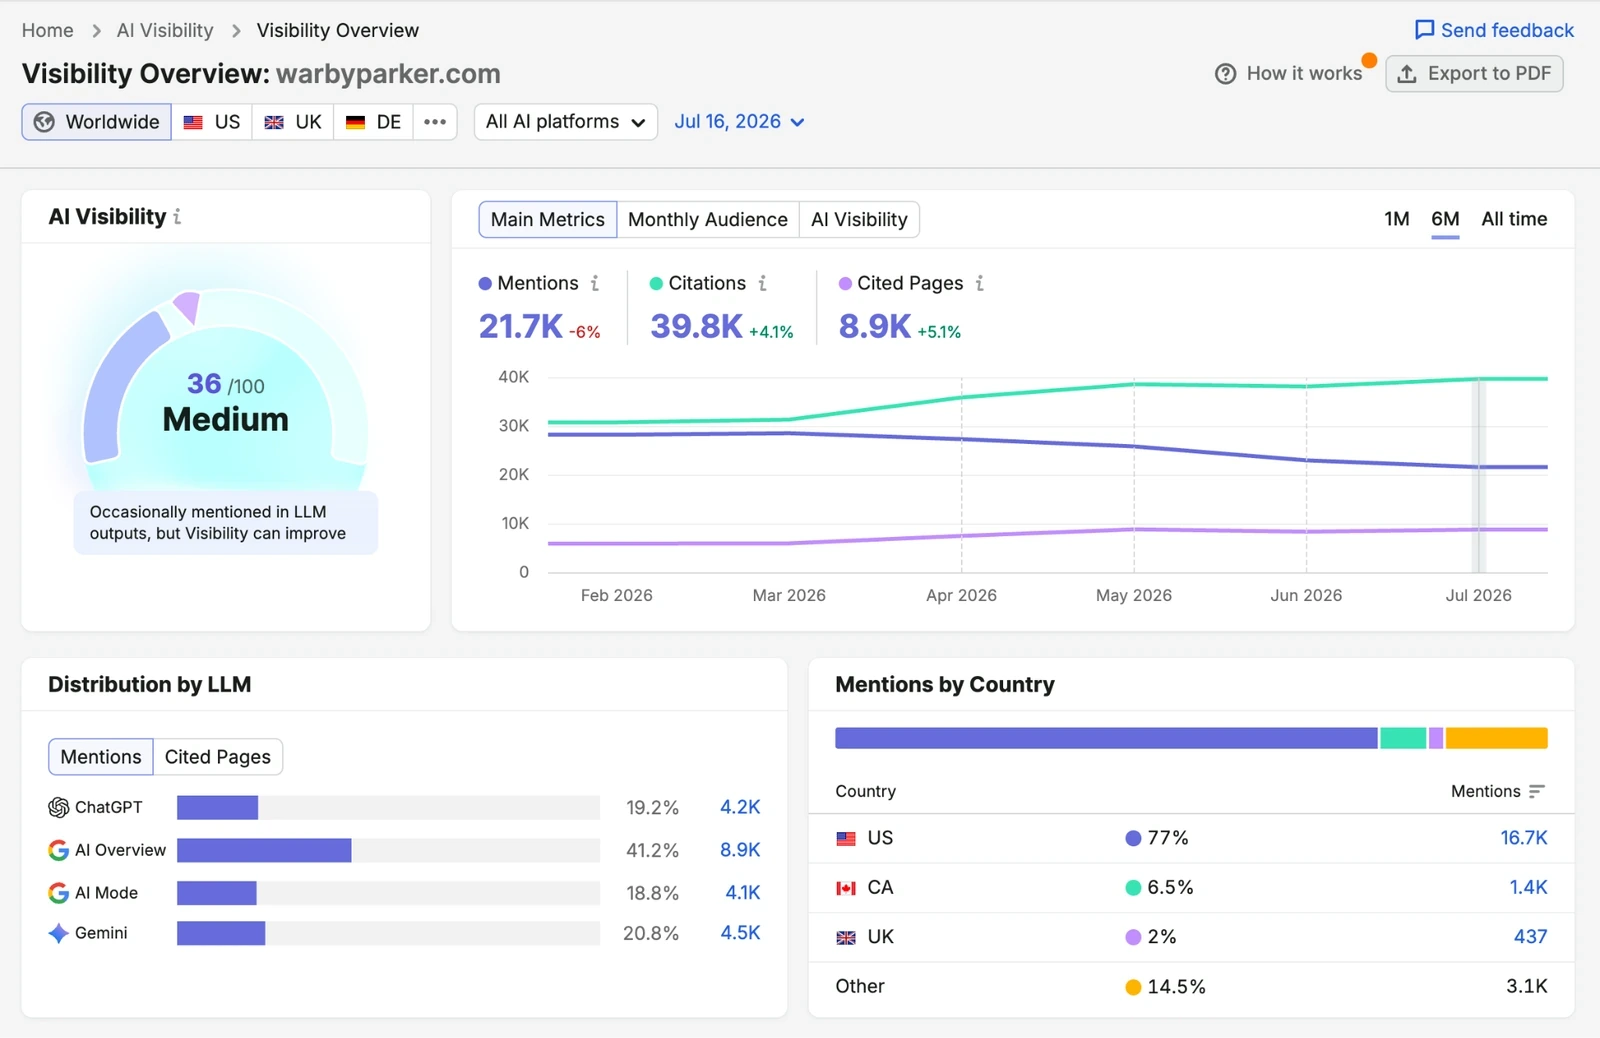
Semrush AI Visibility Toolkit provides reporting for brand visibility, sentiment, competing businesses, prompt discovery, and AI search monitoring.
Its Prompt Tracking feature supports recurring observations across selected AI platforms, while broader reports provide market and competitor context.
Semrush’s own documentation describes an AI Visibility Score used to benchmark brand presence within its methodology.
This can be helpful for investigating relative changes inside the Semrush reporting environment, but it shouldn’t be compared directly with another provider’s visibility score without reviewing the underlying calculations.
Digimetrics
Disclosure: DigitalMarketingTools.ai is sponsored by Digimetrics.ai, which is developed by MediaOne.
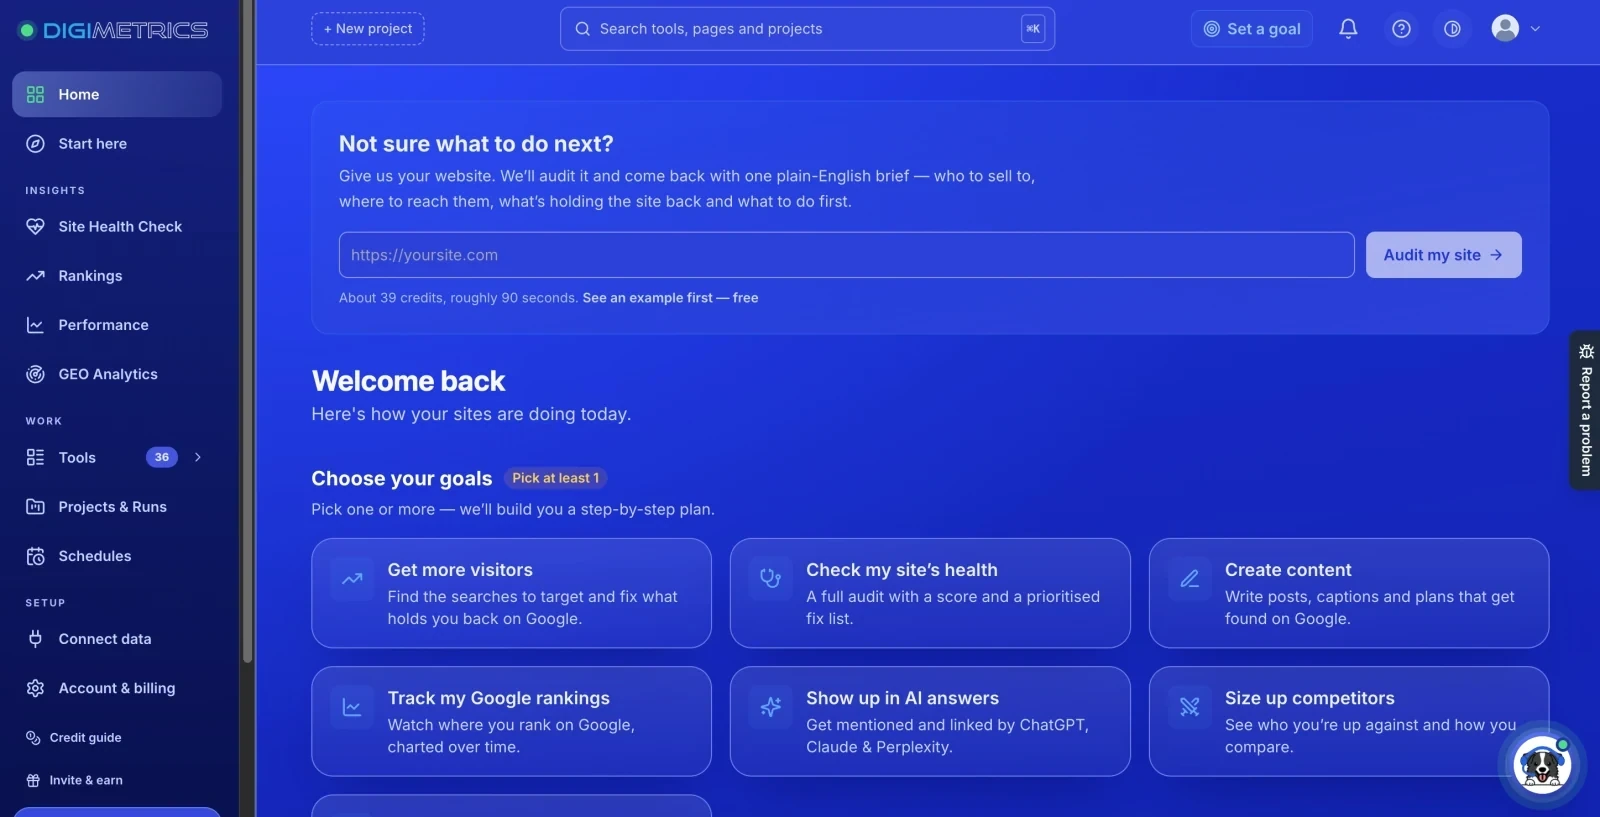
Digimetrics combines SEO analysis, AI visibility tools, technical diagnostics, content optimisation, and other marketing functions within one workspace.
Its publicly documented AI Visibility and GEO toolkit includes AI Mentions Tracker, AI Discovery Audit, GEO On-Page Optimisation, and GEO+SEO Forensic Audit.
This makes Digimetrics relevant to teams that want to investigate an AI visibility issue and continue into related technical or content work without necessarily moving to a separate platform.
For example, a business might identify a brand visibility gap, review the information on a relevant landing page, and investigate whether technical accessibility or content quality requires attention.
However, an integrated workflow doesn’t automatically mean that the platform provides more accurate measurements than specialist GEO analytics software.
Businesses should verify its supported AI systems, collection methods, response-level evidence, exports, and credit limits before using it for recurring GEO reporting.
What Features Should You Look for in a GEO Analytics Tool?
The best GEO analytics tool depends on which decisions the business needs to support.
A publisher investigating cited articles may prioritise URL-level source reporting. A software company comparing its brand with competitors may care more about entity recognition, commercial prompts, and response context.
Several capabilities are worth checking before purchasing.
Transparent Metric Definitions
A platform should explain exactly what counts as a mention, citation, impression, or visibility event.
It should also disclose whether the numbers come from first-party reports, sampled answers, estimated audience models, or another collection method.
Without those definitions, even a well-designed dashboard can encourage misleading conclusions.
Response-Level Evidence
The ability to inspect the original prompt and collected answer is particularly important.
Marketers should be able to verify whether their brand appeared, what the assistant said, which sources were cited, and whether the tool classified the observation correctly.
A visibility percentage without supporting evidence provides limited value for editorial or competitive decisions.
Relevant AI Platform Coverage
Tools differ in their support for ChatGPT Search, Google AI Overviews, Google AI Mode, Gemini, Perplexity, and Microsoft Copilot.
Monitoring one product doesn’t automatically represent every AI experience within the same company’s ecosystem.
Confirm the exact platform, geographic market, language, and collection method before treating its data as representative.
Historical Monitoring and Stable Comparisons
A reporting system should preserve previous observations and identify when they were collected.
This makes it possible to investigate changes without relying entirely on current snapshots.
However, consistent monitoring also requires stable prompts, platform settings, brand definitions, and reporting rules.
If the underlying dataset changes, the dashboard should make that clear.
Competitor and Topic Segmentation
Competitor reporting is most useful when the businesses being compared actually compete for the same customers.
Topic segmentation adds context by separating informational questions from commercial comparisons and problem-solving prompts.
A business may perform well in educational questions but rarely appear in product recommendations.
Those outcomes support different decisions and shouldn’t necessarily be combined into one overall score.
Reporting and Integration Options
Useful GEO reporting should be easy to connect with existing SEO and marketing analysis.
Look for exports, historical records, API access, or dashboard integrations where necessary.
The right reporting setup should allow a team to connect AI observations with website and business performance without losing the context behind the measurements.
Monitoring Costs and Usage Limits
GEO tools may charge by prompt, response, AI engine, project, market, or credits.
A subscription advertising a large number of features may still have restrictions that make the intended workflow expensive.
Calculate your expected monitoring volume and compare how each provider bills for it.
If you’re evaluating products before purchasing, our comparison of GEO tools with free trials explains how to check access conditions and trial allowances.
How to Build a Practical GEO Analytics Workflow
GEO analytics becomes more useful when the team follows a repeatable process rather than checking unrelated prompts whenever a dashboard score changes.
A manageable initial workflow can be built around a defined prompt set, a small number of platforms, consistent reporting periods, and clear review responsibilities.
Step 1: Define the Business Questions
Start with the information your organisation actually needs.
A software company might want to know whether its brand appears in relevant product comparisons, whether its documentation receives citations, and whether customers arrive through measurable AI-related referral channels.
A content publisher may focus more heavily on cited articles and topic coverage.
These questions determine which metrics deserve attention.
Step 2: Build a Balanced Prompt Sample
Prepare questions representing informational research, commercial evaluation, competitor comparisons, and relevant customer problems.
A small business might begin with twenty to thirty prompts. This is a practical starting suggestion, not a statistically representative sample of all AI searches.
Avoid monitoring only questions that explicitly name your business, because doing so can inflate apparent visibility.
Group the prompts by topic and intent so the resulting reports remain understandable.
Step 3: Establish a Baseline
Collect the initial observations across selected AI experiences.
Record the prompt, platform, collection date, market, language, brand appearances, and visible citations.
If a response fails to load or cannot be collected, identify the missing observation rather than silently including it in the denominator.
The baseline should describe the dataset actually observed, not simply the number of checks that were scheduled.
Step 4: Review First-Party Reporting
Compare the monitored-response observations with relevant information from Google Search Console and Bing Webmaster Tools.
For example, a website might show increasing Google generative-AI impressions while its tracked brand mention coverage remains relatively stable.
That isn’t necessarily a contradiction.
The two systems measure different events, and the underlying prompt samples may not correspond to the searches generating first-party impressions.
Investigate the relationship without trying to force both metrics into an identical total.
Step 5: Investigate Meaningful Gaps
Identify questions where competitors appear or receive citations while your business is absent.
Then inspect the underlying answers and relevant sources.
A missing appearance may reflect an information gap, different product positioning, competing evidence, or the AI platform’s response-selection process.
Not every absence requires a new article or technical change.
Prioritise opportunities where improving your website or product information would genuinely help customers.
Step 6: Review Outcomes and Repeat
After making a relevant change, document what was updated and when.
Continue monitoring comparable questions while also reviewing first-party reporting and measurable website activity.
Look for sustained patterns rather than treating one generated answer as proof that the change succeeded.
A monthly review may be sufficient for some businesses, while teams managing competitive product categories may need more frequent checks.
How Do You Measure the ROI of GEO Analytics?
Return on investment is one of the most difficult GEO measurement questions because much of the relevant visibility may occur without a website visit.
A brand could be recommended inside an AI-generated answer, influence a customer’s research, and receive no direct click.
Conversely, a measurable referral visit might be attributable to an AI source without providing enough evidence to establish how the visitor first encountered the business.
The most defensible approach is to separate observed activity from estimated influence.
Track Attributable Website Activity
Use GA4 or another analytics system to investigate identifiable visits from relevant AI-related sources.
Review landing pages, engagement, conversions, and other meaningful events.
Where referral information is unavailable, don’t assume that every unclassified direct visit originated from AI.
Tracking limitations should be disclosed rather than hidden.
Evaluate Business Outcomes
For service businesses, useful outcomes may include qualified enquiries or bookings.
For ecommerce businesses, purchases and revenue are more directly relevant.
These outcomes can be compared with GEO reporting trends when sufficient data is available.
However, correlation doesn’t automatically establish that a change in AI visibility caused a change in sales.
Calculate the Cost of Your GEO Workflow
The subscription fee isn’t the only cost involved.
Consider the time spent configuring prompts, reviewing responses, investigating sources, preparing reports, and implementing improvements.
A GEO tool may be worth paying for when it reduces that workload or reveals useful information that wouldn’t otherwise be available.
The business case becomes weaker when the team regularly collects data but rarely acts on it.
Useful GEO analytics should improve decisions and reporting efficiency, not simply increase the number of metrics being monitored.
Common GEO Analytics Mistakes to Avoid
Treating Visibility Scores as Universal Measurements
Proprietary GEO scores depend on vendor-defined datasets and calculations.
Don’t compare them directly without understanding the measurement methods.
Confusing Brand Mentions With Website Citations
A brand can appear in a response without receiving a source link.
Keep mention and citation measurements separate.
Assuming AI Citations Generate Traffic
A citation can appear without anyone clicking it.
Analyse citation visibility and measurable referral activity as different outcomes.
Monitoring Only a Few Convenient Questions
A small, heavily branded prompt sample may produce encouraging numbers without reflecting broader customer discovery.
Include questions across relevant intents and document the sample.
Ignoring Geographic and Platform Differences
AI-generated answers may vary by location, platform, language, and collection time.
Comparisons should account for these differences where possible.
Claiming Revenue From Unmeasured Exposure
Brand visibility can have value beyond directly attributable clicks, but its exact contribution may be difficult to establish.
Avoid assigning precise revenue figures to individual AI mentions without supporting evidence.
Final Verdict: What Makes a GEO Analytics Tool Worth Using?
A GEO analytics tool helps businesses understand how their brands and content appear within AI-generated search experiences.
Its value comes from making that information measurable, interpretable, and useful for decision-making.
Google Search Console and Bing Webmaster Tools provide important first-party evidence through generative-AI impressions and citation reporting. Specialist tools such as Otterly.AI, Peec AI, Ahrefs Brand Radar, and Semrush add different forms of prompt monitoring, competitor analysis, and broader visibility research.
Digimetrics offers an integrated approach that connects AI-related analysis with SEO, technical auditing, and content workflows.
However, no single platform provides a complete record of every AI interaction or guarantees that increased visibility will result in sales.
The strongest GEO analytics setup combines relevant response observations, first-party search reporting, website analytics, and business outcomes while respecting the limitations of each dataset.
The goal isn’t to prove that your brand has the highest possible GEO score. It’s to understand where your business appears, why the information matters, and which improvements are supported by credible evidence.
Frequently Asked Questions
What Is a GEO Analytics Tool?
A GEO analytics tool measures how brands, websites, and content appear within AI-generated search experiences. Depending on the platform, it can track brand mentions, citations, competitors, relevant prompts, visibility trends, and other Generative Engine Optimization signals. The measurements may come from first-party reporting, sampled AI responses, or connected analytics systems.
What Does GEO Analytics Measure?
GEO analytics can measure observed brand mentions, citation activity, prompt coverage, share of voice, sentiment, and competitor visibility. Some reporting systems also incorporate first-party AI search impressions and identifiable referral traffic. These measurements describe different events and shouldn’t be treated as interchangeable.
What Is the Difference Between GEO Analytics and SEO Analytics?
SEO analytics traditionally focuses on search performance, including rankings, impressions, clicks, and website traffic. GEO analytics examines how brands and content are represented within AI-generated answers. The two approaches overlap but provide different evidence about discovery and customer research.
Can Google Analytics 4 Track GEO Performance?
GA4 can help measure identifiable website visits and conversions associated with AI-related traffic sources. However, it cannot directly identify every time an AI assistant mentions a business or cites a webpage. A broader GEO measurement setup may combine GA4 with first-party search reporting and specialist AI visibility monitoring.
Does Google Search Console Provide GEO Analytics?
Google Search Console provides dedicated generative-AI performance reporting for supported Google Search experiences, including AI Overviews and AI Mode. These reports include impression measurements by page, country, device, and date. They don’t provide complete cross-platform competitor or brand mention monitoring.
Is GEO Analytics the Same as AI Search Visibility Tracking?
AI search visibility tracking is a major part of GEO analytics, but the broader measurement process can also include first-party impressions, citation reporting, website engagement, and business outcomes. GEO analytics aims to connect those measurements rather than concentrate only on whether a brand appears in monitored answers.
What Is AI Share of Voice in GEO Analytics?
AI share of voice is a relative visibility metric comparing a brand with selected competitors within a defined dataset. Different vendors calculate it using different methods, including mention frequency or estimated impressions. The results should be interpreted within the provider’s methodology rather than treated as universal market share.
Can GEO Analytics Show How Much Traffic ChatGPT Sends?
Website analytics can identify some visits referred by ChatGPT and other AI-related sources when sufficient referral or attribution information is available. However, not every interaction produces a click, and some visits may lack identifiable source information. GEO analytics therefore cannot establish complete ChatGPT-driven audience exposure from referral data alone.
What Is the Best GEO Analytics Tool?
The best tool depends on what needs to be measured. Google Search Console and Bing Webmaster Tools provide useful free first-party reporting. Otterly.AI and Peec AI focus on prompt-based AI visibility, Ahrefs and Semrush support broader research, and Digimetrics combines GEO-related tools with other marketing workflows. A meaningful comparison requires evaluating the same reporting needs and evidence requirements.
Can GEO Analytics Improve AI Search Rankings?
GEO analytics can identify information gaps, inaccurate brand descriptions, and questions where competitors appear. However, it doesn’t directly control generated answers or guarantee a ranking position. The findings can guide useful content and technical improvements, but future citations or brand mentions are not guaranteed.
How Often Should Businesses Review GEO Analytics?
The appropriate frequency depends on the business and its monitoring needs. Weekly or monthly reviews may be sufficient for smaller organisations, while highly competitive markets may justify more frequent collection. Consistent prompts, clear methodology, and useful follow-up actions matter more than collecting frequent reports without a purpose.
Disclosure: digitalmarketingtools.ai is sponsored by Digimetrics.ai. Sponsored Highlights are clearly labelled advertising. Our reviews, comparisons and guides are written to be useful and fair regardless of who sponsors the site. Read the full disclosure.